Date Published September 18, 2018 - Last Updated February 11, 2019
Each month, I highlight one Key Performance Indicator (KPI) for service and support. I define the KPI, provide recent benchmarking data for the metric, and discuss key correlations and cause-and-effect relationships for the metric. The purpose of the column is to familiarize you with the KPIs that really matter to your organization and to provide you with actionable insight on how to leverage these KPIs to improve your performance!
This month, I depart from our usual format, and instead of discussing a single metric, I will introduce and discuss a number of metrics that are unique to chat.
The Chat Channel
If you are like most consumers, you have probably experienced a chat session. Perhaps you engaged in chat with an agent at your bank or insurance company to resolve a payment issue. Or you may have used chat to troubleshoot your new computer or a software application you installed.
Why chat? One reason is that some people simply prefer this channel for service and support. Chat is the channel of choice for a growing number of consumers and businesses, particularly among millennials. The second reason is economics. An effective chat channel can significantly reduce the cost per transaction versus a more traditional live voice support model. Because of this, chat has the potential to both improve customer satisfaction (by giving customers an alternative channel choice) and reduce the cost per ticket.
Costs are typically lower in the chat channel because chat agents can handle more than one chat session at a time. These are called concurrent sessions, and some agents are talented and skilled enough to handle as many as four concurrent chat sessions. When agents handle more than one session at a time, the cost per session is reduced accordingly.
Costs are typically lower in the chat channel because chat agents can handle more than one chat session at a time.

Chat Metrics
Many chat metrics simply mirror their live agent counterparts. For example, customer satisfaction for chat is the same metric as customer satisfaction for the live voice channel. However, the values for the metrics in each channel are likely to be different—sometimes dramatically different. Customer satisfaction in the traditional voice channel might be 80%, while customer satisfaction for chat might be 90%, or vice versa.
The metrics listed below are common to both the chat and voice channels. Some names might vary slightly—for example, speed of answer in the voice channel becomes speed of response in the chat channel, and call abandonment rate becomes chat abandonment rate in the chat channel.
Cost Metrics
- Cost per Chat Session
- Cost per Minute of Chat Handle Time
Productivity Metrics
- Chats per Chat Agent per Month
- Chat Agent Utilization
- Ratio of Chat Agents to Total Headcount
Service Level Metrics
- Average Speed of Response
- Chat Abandonment Rate
- Percent of Chats Answered in 30 Seconds
Quality Metrics
- Customer Satisfaction
- Chat First Contact Resolution Rate
- Chat Quality
Agent Metrics
- Annual Chat Agent Turnover
- Daily Chat Agent Absenteeism
- Chat Agent Occupancy
- New Chat Agent Training Hours
- Annual Chat Agent Training Hours
- Chat Agent Tenure
- Chat Agent Job Satisfaction
Contact Handling Metrics
There is another category of metrics unique to chat. These include the following:
Percent of Contacts Originating in Chat. As the name suggests, this is the percentage of all contacts coming into the service desk that originate in the chat channel. As a chat channel matures, this metric typically increases.
Percent of Contacts Resolved in Chat. This number will be less than or equal to the percent of contacts originating in chat. Once again, as the chat channel matures, this metric typically increases.
Percent Failover Rate from Chat to Voice. This measures the percentage of chats that “failover” to a live agent voice contact. This happens when the agent or caller feels that voice communication is needed, and they revert from the chat channel to the voice channel to complete a transaction.
Average Concurrent Chat Sessions. This metric indicates the average number of concurrent sessions a chat agent has open at any given time. The ability to handle concurrent chat sessions is the primary economic advantage of the chat channel.
Maximum Concurrent Chat Sessions. Most organizations will limit the number of concurrent sessions an agent is allowed to handle. Newer agents might be limited to a single chat session at a time, while more experienced agents might be allowed to handle as many as two or three concurrent chat sessions. However, as the number of concurrent chat sessions increases, each customer will end up waiting longer between interchanges with the chat agent. When this latency gets too long, the customer may become frustrated and abandon the chat and possibly even revert back to voice as their preferred channel of support.
Service desks that are interested in growing, improving, and optimizing chat can use these metrics to effectively manage the chat channel.
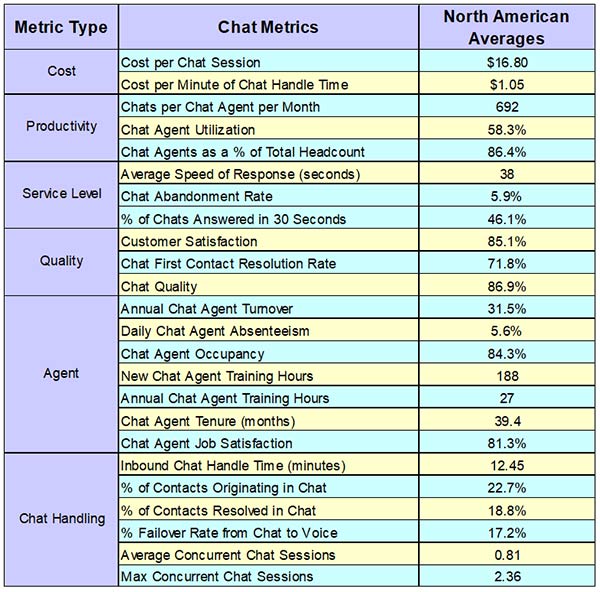
Benchmarking Data for Chat
Chat data from MetricNet’s benchmarking database is excerpted in the figure below. Please note that only averages are shown; the range for each metric, from high to low, can be quite large and dramatic.
Ideally the chat channel should enrich the user experience by providing channel choice and high-quality transactions. However, the agent skill set required for chat is somewhat different than that required of a live voice agent. You should not automatically assume that a successful voice agent will be a successful chat agent, and vice versa.
Please join me for next month’s Metric of the Month: Ratio of Agents to Total Headcount, a service desk and desktop support metric that yields insight into the managerial efficiency of IT service and support.
Get your service management content in person at Service Management World!
Join us!
Jeff Rumburg is the winner of the 2014 Ron Muns Lifetime Achievement Award, and was named to HDI’s Top 25 Thought Leaders list for 2016. As co-founder and CEO of MetricNet, Jeff has been retained as an IT service and support expert by some of the world’s largest corporations, including American Express, Hewlett Packard, Coca-Cola, and Sony. He was formerly CEO of the Verity Group and Vice President of Gartner. Jeff received his MBA from Harvard University and his MS in Operations Research from Stanford University. Contact Jeff at
[email protected]
. Follow MetricNet on Twitter @MetricNet.