Date Published April 11, 2018 - Last Updated December 13, 2018
Each month, I highlight one Key Performance Indicator (KPI) for service and support. I define the KPI, provide recent benchmarking data for the metric, and discuss key correlations and cause-and-effect relationships for the metric. The purpose of the column is to familiarize you with the KPIs that really matter to your organization and to provide you with actionable insight on how to leverage these KPIs to improve your performance! This month, I focus on net promoter score.
Jeff taught the Succeeding with Metrics pre-conference class at HDI 2018.
Learn more!
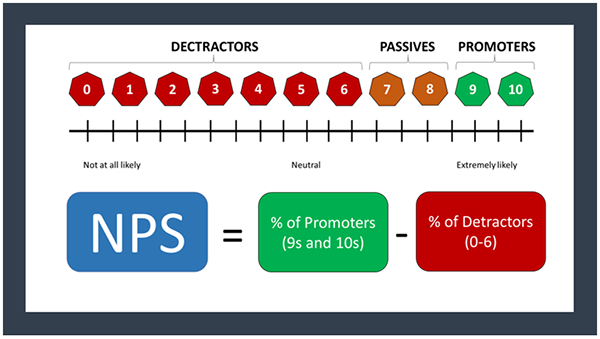
Net promoter score (NPS) is based on the idea that every organization’s customers can be divided into three categories: Promoters, Passives, and Detractors. By asking one question—How likely is it that you would recommend our service to a friend or colleague?—you can track these groups and get a clear measure of your support organization’s performance from the customer’s perspective. Customers respond on a 0-to-10-point rating scale, categorized as follows:
-
Promoters (score 9-10) are loyal enthusiasts who will refer others to your support organization.
-
Passives (score 7-8) are satisfied but unenthusiastic customers who may choose another source of support if given the chance.
-
Detractors (score 0-6) are unhappy customers who can damage your reputation through negative word-of-mouth.
To calculate your support group’s NPS, simply take the percentage of customers who are Promoters and subtract the percentage who are Detractors. Your Net Promoter score can be as low as −100% (everybody is a detractor) or as high as +100% (everybody is a promoter). An NPS that is positive (i.e., higher than zero) is thought to be good, and an NPS of +50% or greater is excellent.
IT support groups that track NPS will typically follow the initial question with an open-ended request for elaboration, soliciting the reasons for a customer's rating of their IT support. These reasons can then be provided to front-line employees and management teams for follow-up action and improvement initiatives.
Benchmark Data for NPS
NPS is a relatively new metric and is currently tracked by approximately 25% of all service desks and desktop support groups. However, the majority of organizations tracking NPS are providing support to external businesses or consumers, where NPS is viewed as a leading indicator of customer loyalty and follow-on business. This would include hardware and software vendors who use NPS to gauge customer loyalty, as well as managed service providers who want to know if you are likely to recommend their services to others.
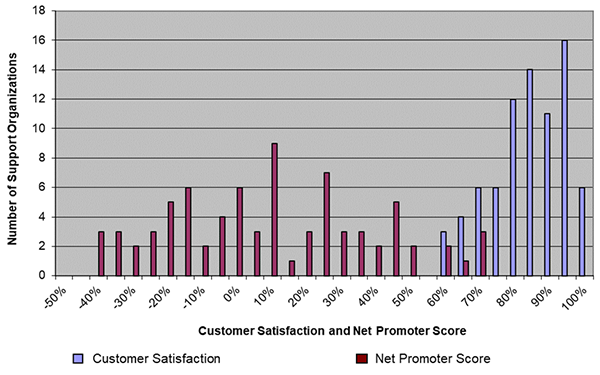
MetricNet’s benchmarking data for customer satisfaction and net promoter scores is shown in the figure below for 74 IT support organizations that track both metrics. As you can see, the customer satisfaction score for this particular data set is always higher than the Net Promoter score. This is generally the case, as it is extremely rare for an organization to have a higher NPS than customer satisfaction score. Put another way, it is much easier to create a satisfied customer than it is to create a customer who is willing to put their credibility on the line by recommending your service.
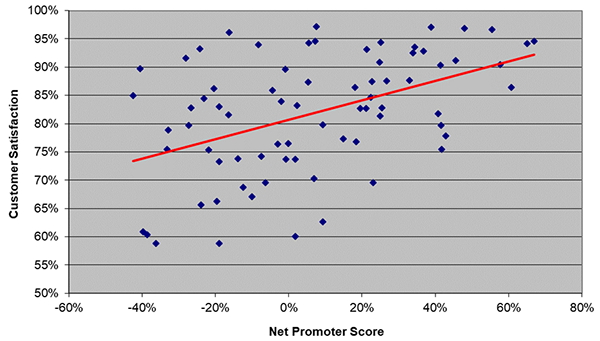
Since NPS is both a quality and a loyalty metric, one would expect there to be a correlation between NPS and customer satisfaction. There is, in fact, a correlation between these two metrics, but it is not as strong as one might expect. The figure below shows the strength of this correlation for the same 74 support organizations referenced in the figure above. This reinforces the notion that NPS measures something different than customer satisfaction (i.e., customer loyalty), and that customer loyalty and satisfaction are two distinct but related metrics.
You would expect a correlation between NPS and customer satisfaction, but it is not as strong as one might expect.

The benchmarking ranges and averages for the data in the two charts above are summarized in the table below.
 The key question with any IT service and support metric is whether it helps the organization operate more efficiently and effectively. Does it provide useful feedback that helps agents and technicians deliver exceptional customer service? Does it provide a tracking mechanism that enables week-over-week and month-over-month comparisons? Those who track this metric believe that it does. But it is worth noting once again that NPS is employed primarily by IT service and support organizations that are supporting an external customer base.
Please join me for next month’s Metric of the Month: Mean Time to Resolve (MTTR), a critical service level metric for desktop support.
Jeff Rumburg is the winner of the 2014 Ron Muns Lifetime Achievement Award, and was named to HDI’s Top 25 Thought Leaders list for 2016. As co-founder and CEO of MetricNet, Jeff has been retained as an IT service and support expert by some of the world’s largest corporations, including American Express, Hewlett Packard, Coca-Cola, and Sony. He was formerly CEO of the Verity Group and Vice President of Gartner. Jeff received his MBA from Harvard University and his MS in Operations Research from Stanford University. Contact Jeff at
[email protected]
. Follow MetricNet on Twitter @MetricNet.