Date Published August 25, 2020 - Last Updated December 10, 2020
Looking ahead into the future has always sounded like there is some sort of magic involved. However, in a support center world, especially in large-scale operations, looking ahead into the future involves a lot of complex modeling, math, calculations, a bit of art, and some luck. You need to create a capacity model as part of your capacity planning. There are three components to a capacity model: frontline needs, supporting the frontline, and the movement of people.
A capacity model is used to determine and predict what future staffing needs will be for your operation in order to meet the incoming volume needs of your end users or customers. This task typically falls into the hands of a workforce management team. This also typically involves some sort of workforce management tool designed to help you with calculating what your day looks like with several variables. Due to the complex math involved, these calculators are best to use.
However, many capacity planners fall short because the capacity model has only been used for the frontline FTE counts without including all of the additional roles within the department. I would like to share with you a method that not only accounts for the future frontline needs, but also shows how to consider all roles such as supervisors, managers, QA, and other support personnel and their calculations.
How Accurate Do You Need to Be?
Depending on the method and approach to calculating the FTE need of incoming volume, you may get a significantly different result. You need to ask yourself how accurate do you need to be. You first must establish your approach to calculate incoming volume coverage needs. Remember, there are several inputs that will sway the number of FTEs needed such as talk time and service levels. However, volume is the number one input that must be accurate. If all else is equal but volume is higher or lower, your FTE needs will change with the ebbs and flows of your volume. Therefore, this step towards an accurate capacity model is crucial.
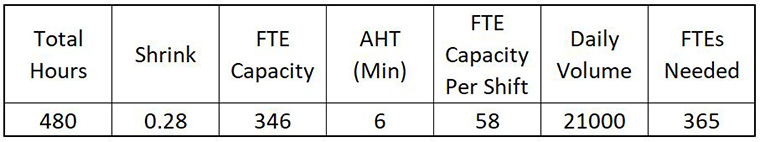
As an example, many people do what I call back of the napkin math calculations. Let’s hypothetically say your daily volume is 21,000 incoming contacts, and you are open from 8:30 a.m. to 8:00 p.m. Monday–Friday. A straight-up calculation would be similar to this calculation and use these assumptions:
An FTE’s day (8 hours or 480 minutes), 28% shrink, 6 minutes AHT, 21,000 daily contacts
However, in the real world, your volume comes in at different intervals during the day, called daily distribution. There are potential delay times in the queue. There are other variables such as adherence to schedules.
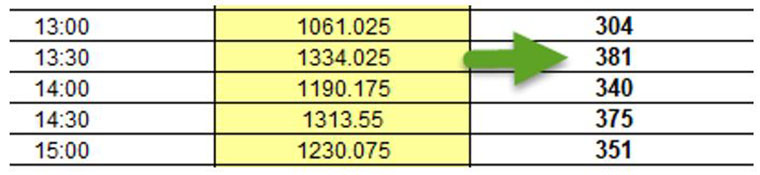
By using a tool designed for these calculations, the output is much different. Using the same example, (volume, AHT, etc.) but now adding 80% service level in 60 seconds, and half hour incremental distribution of the 21,000 contacts, the calculations show a higher FTE need at 381, or a 16 FTE difference in the results.
The difference of 16 FTEs in the organization has a direct cost impact. If you have been understating your FTE need and can’t quite figure out why you seem to always be understaffed for your operation, it may be due to the back of the napkin math calculation. If your average monthly cost per agent is $2,500, your 16 FTE understatement is a $480K oversight. And, that does not include any additional management, QA, or other costs.
I would advise using tools that are more equipped to calculate the needs with variables that are most common in workforce management, including more complex operations that use multiple channels to support. The chat channel is most complex because you could have FTEs chatting concurrently 2–3 chats at a time during the coverage hours. Most tools have inputs to adjust for the efficiencies gained with a multi-channel environment. Once you have formally decided how to calculate your FTE needs, your capacity planning for frontline is now complete.
A Capacity Model for the Entire Support Organization
Once the FTE needs are calculated for the incoming volume, you might think that your capacity model is complete. However, there is a whole other side to your support organization to ensure you are operating as proficiently as possible. We still need to account for supervisors, managers, leadership, and other support roles. Remember, the number one cost of your operation is people. In order to more accurately understand the financial impact of your capacity model, every roll must be accounted for.
Remember, the number one cost of your operation is people.

For this next part of the capacity model, determining other support role needs is actually very straightforward. Have you ever conducted an empty-box exercise? This method is a great way to build out an organizational chart. By using ratios, you can easily determine the number of supervisors, managers, and other support roles by conducting an empty box exercise.
Basically, the core, fundamental number you need to establish is how many frontline FTEs your operation will need. That was part one above. After that, everything is just a ratio built off of that core number.
Here is an example of ratios you will need to consider an empty box exercise:
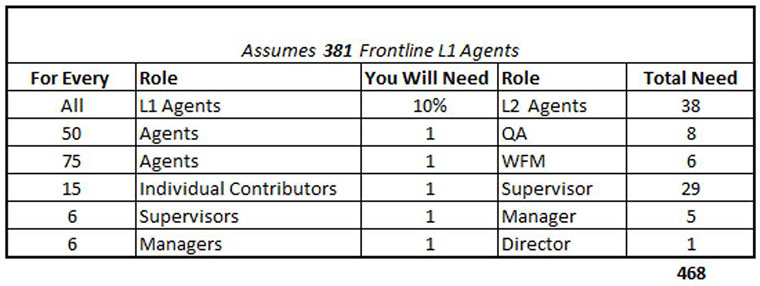
In this example, with 381 agents answering calls and doing their thing, we need an additional 87 FTEs to monitor, supervise, and conduct quality checks. You can create other roles based on your organizational structure as well. For this exercise, I need a total of 468 for my capacity model.
Account for All People Movements
Once your frontline needs are calculated, and your roles based on ratios are set, the last part of the capacity model is to adjust, by month, your forecasted attritions and new hire counts. Using historical data, you can assume a rate of attritions and set the number according to the pattern you see. This is extremely valuable to organizations that have to hire in peak seasons like retail support groups.
The last data point of people movement is crucial: keeping track of your actual head count. By plotting out these changes in head count in the capacity model, you can easily see where you are running under or over your FTE need based on your mathematical Erlang frontline equations, empty box ratios, and attrition assumptions. The end result will look something like this example:
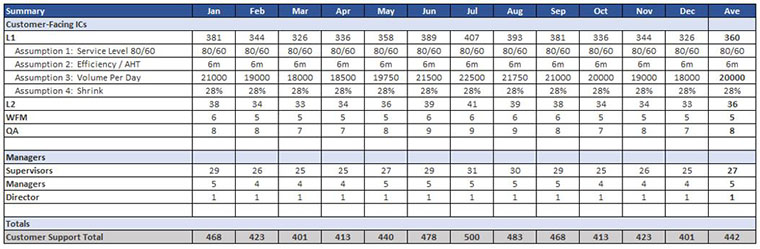
This screenshot is the capacity model with a list of assumptions that generate your FTE counts. Note that when the volume changes, so do the totals of other roles in support of that frontline group. This also maps out what the full year will look like for FTE demand. The next set of data is to match up the FTE need to the attrition and new hire cadence:
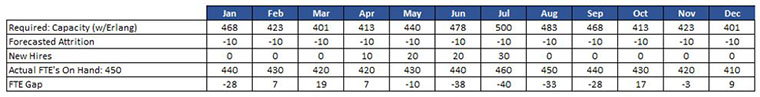
Now that you can easily see the FTE gaps compared to the need, you can better plot out your new hire groups. One suggestion, don’t try to staff to 100% of the peak. Unless you have a way to scale and pivot quickly, staffing to 100% is costly and near impossible, considering the time that it takes to recruit, hire, and onboard.
You now can create an easy visual to articulate your FTE gaps compared to the need across the year and plan accordingly since you have completed the FTE gap analysis:
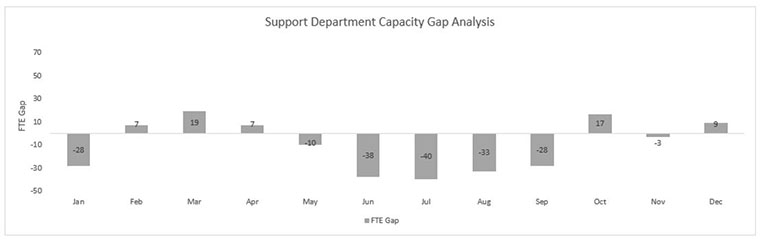
In this example, it is clear we will need some sort of cross training from other programs or to hire part time workers in order to be able to scale up as close the 40 FTE gap in July, but also ramp down fairly rapidly by October. By utilizing part time, or contractors, or resourcing from other programs within the company, you can create your strategic plans going into your busy season.
Do the Math
Creating a capacity model that captures the entire support organization not only informs how to prepare for your busy season, but it is also data based. No emotions or guessing can skew the numbers. In the end, if you change one of the assumptions, the headcount will change. As long as you are in agreement on the assumptions, a capacity model will always determine if you are able to hire, or, during downward seasons, let natural attrition get you to where you need to be during the low seasons.
Capacity planning uses a lot of math and complex formulas. However, it also needs a bit of artistic interpretation on your part. If you have information that will affect your volume, such as product deployments, launches, even seasonality inputs, make sure you are accounting for that in your volume calculations.
Luck plays a part in all of this planning as well. I’ve never known of a big internet outage that was planned. Remember, things happen, and even the best battle plan can go out the window after the first shot!
Richard Sykora has more than 25 years’ experience in customer service and call center operations. He has managed both national and global operations and has been a speaker at industry conferences and user groups, leading participants in industry best practices. Richard is Senior Manager, Support Operations at Blackbaud, and is Lean Practitioner Certified. He is a volunteer and currently Chair of ReStart Career Development program, assisting those in a career transition and helps connect participants’ natural skills to jobs and careers they were built for with purpose. Connect with Richard on
LinkedIn
.