Date Published December 29, 2020 - Last Updated January 20, 2023
Best of HDI in 2020 - #2
Each month, I highlight one Key Performance Indicator (KPI) for service and support. I define the KPI, provide recent benchmarking data for the metric, and discuss key correlations and cause-and-effect relationships for the metric. The purpose of the column is to familiarize you with the KPIs that really matter to your organization and to provide you with actionable insight on how to leverage these KPIs to improve your performance! This month, I look at Average Speed of Answer.
Average Speed of Answer (ASA) is the total wait time that callers are in queue, divided by the number of voice calls handled. This includes calls handled by an interactive voice response (IVR) system, as well as calls handled by live analysts. Most automatic call distributor (ACD) systems capture this metric.
Let’s say, for example, that in a particular month a service desk accepts 5,000 live voice calls, and the collective time in queue for all calls accepted was 250,000 seconds. For that particular month, the ASA was 50 seconds (250,000 seconds ÷ 5,000 calls accepted). Please note that abandoned calls are not included in the calls accepted number when calculating ASA.
Average speed of answer applies to the live channels of voice and chat. However, for chat, the metric is generally referred to as the average response time (ART). The average response time in chat is calculated in the same way that ASA is calculated for the voice channel. It measures the average wait time from when a chat customer initiates contact in the chat channel, until they receive a live response from an agent. Once again, abandoned chats are not included in the calculation for average response time.
The examples used in this article will refer to average speed of answer for the voice channel. But the principles that apply to ASA in the voice channel are equally applicable to average response time in the chat channel.
Why It’s Important
ASA is one of the most widely tracked metrics in the technical support industry. It indicates how responsive a service desk is to incoming calls. Almost everyone who works in service and support can tell you their ASA off the top of their head. Since most service desks have an ASA target, ASA is tracked to ensure service-level compliance.
There is a common perception in service and support that faster (lower) ASAs are better. This would be true if faster ASAs did not cost anything. But faster ASAs do come with a price, and that price can be quite high. Let’s say, for example, that a service desk has an ASA of 60 seconds, and they are spending $20 per ticket. Let’s further assume that they can forecast using their workforce scheduling tool that ASA can be reduced to just 30 seconds if they add five additional front-line analysts. However, with five additional FTEs their cost per ticket would increase to $24. Is a 30 second reduction in ASA worth an increase of $4 per ticket? Probably not. And here’s why.
Contrary to popular belief, low ASAs do not drive customer satisfaction. So, to continue with our example, if we spend $4 more per ticket to drive our ASA from 60 seconds to 30 seconds, but we see no improvement in customer satisfaction, why bother? We would be spending money and getting nothing in return.
Contrary to popular belief, low ASAs do not drive customer satisfaction.

The first figure below illustrates the relationship between ASA and cost per ticket. It’s quite obvious that as ASA decreases, cost goes up. This is because low ASAs are most often the result of over-staffing on the service desk. However, the next figure clearly shows that as long as ASA remains less than 30% of ticket handle time, there is no customer satisfaction benefit to be gained by further reducing ASA. Conversely, longer ASAs will not impact customer satisfaction until ASA exceeds 30% of your average handle time. (Please note that the second figure our x-axis is not ASA in seconds, but rather ASA as a percent of average handle time.)
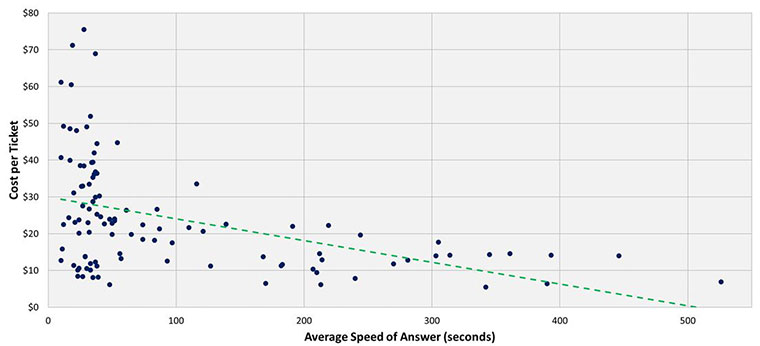
This is a profound insight because it indicates customers know that ASA is almost always relatively small compared to the total transaction time. If your ASA is 3 minutes and your handle time is 10 minutes per ticket, the total transaction time is 13 minutes. The 3-minute ASA represents 30% of the ticket handle time, but just 23% of the total transaction time (ASA + Handle Time). Moreover, driving down your ASA will do nothing to increase customer satisfaction, but it will almost certainly increase your costs.
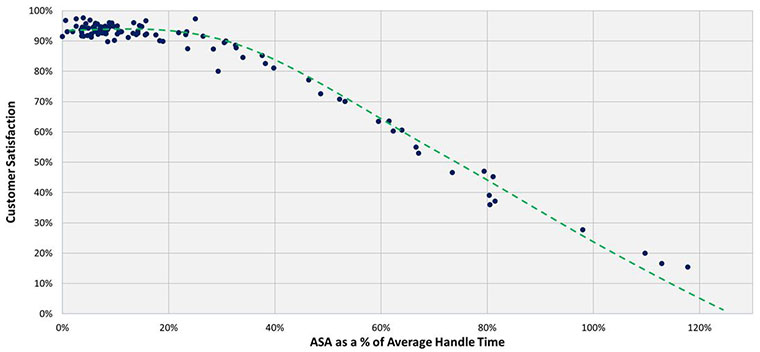
This suggests that there is a “sweet spot” where ASA can be optimized to minimize costs without sacrificing customer satisfaction. That sweet spot appears to be when ASA is between 25% and 30% of average handle time.
Benchmark Data for Average Speed of Answer
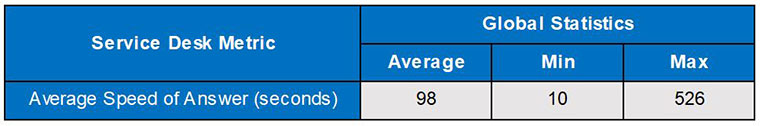
As table below shows, the average speed of answer for service desks worldwide is 98 seconds, but the metric varies dramatically, from a low of 10 seconds to a high of 526 seconds. As a general rule-of-thumb, a good target for ASA is 25% of your average handle time.
Improving Average Speed of Answer
As mentioned above, increasing your analyst headcount is one way to reduce ASA. However, that’s a costly approach, and there are other low-cost/no-cost approaches to improving (reducing) ASA. These include better workforce scheduling and improving analyst schedule adherence.
For service desks that have never used a true workforce scheduling tool, with Erlang C simulation and forecasting capabilities, it is not uncommon to see a significant improvement in analyst utilization when a scheduling tool is adopted. This, in turn, has the effect of reducing ASA. But a workforce schedule is only as good as the adherence to the schedule, so it’s important to build a culture of compliance to the workforce schedule. Any backlog of calls or chats should evoke an “all-hands-on-deck” response from the workforce. Anything short of that response during peak call and chat times is an indication of poor compliance with the workforce schedule, which leads to longer ASAs.
Please join me for next month’s Metric of the Month: Ticket Backlog, a desktop support and field services metric that has gained widespread acceptance in recent years.
Jeff Rumburg is the winner of the 2014 Ron Muns Lifetime Achievement Award, and was named to HDI’s Top 25 Thought Leaders list for 2018. As co-founder and CEO of MetricNet, Jeff has been retained as an IT service and support expert by some of the world’s largest corporations, including American Express, Hewlett Packard, Coca-Cola, and Sony. He was formerly CEO of the Verity Group and Vice President of Gartner. Jeff received his MBA from Harvard University and his MS in Operations Research from Stanford University. Contact Jeff at
[email protected]
. Follow MetricNet on Twitter @MetricNet.