Date Published March 26, 2020 - Last Updated January 20, 2023
Each month, I highlight one Key Performance Indicator (KPI) for service and support. I define the KPI, provide recent benchmarking data for the metric, and discuss key correlations and cause-and-effect relationships for the metric. The purpose of the column is to familiarize you with the KPIs that really matter to your organization and to provide you with actionable insight on how to leverage these KPIs to improve your performance! This month, I look at customer effort.
Customer effort is both a service desk and a desktop support metric. It measures how easy it is for your customers to do business with you. The metric is captured by surveying your customers and asking them the following question: How easy was it to get the resolution you wanted today? Measured on a scale of 1–7, a customer effort score (CES) of 1 indicates an extremely difficult experience, while a CES of 7 indicates an effortless experience.
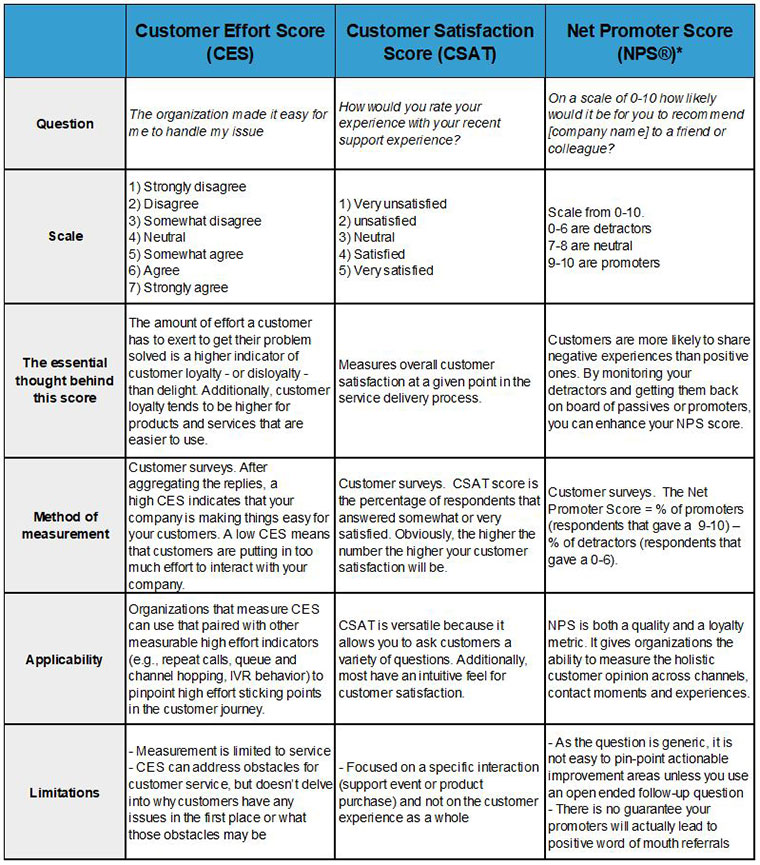
Customer effort, along with customer satisfaction and net promoter score are the three metrics that comprise the customer experience. Increasingly, customer effort, customer satisfaction, and net promoter are combined into a single customer survey where the customer is asked to rate their experience on all three metrics, thereby producing an overall customer experience score. In previous Metric of the Month articles, I have discussed not only customer experience, but also customer satisfaction and net promoter.
The table below summarizes key elements of the three metrics that comprise the customer experience.
Why It’s Important
Customer effort was first introduced in 2008 by the Corporate Executive Board (CEB). CEB’s research demonstrated that a reduction in customer friction is a better predictor of customer loyalty than one exceptional experience at a single touchpoint. In fact, CEB found that 81% of customers going through a high level of effort are likely to share their bad experience with friends versus only 1% of those who went through an effortless experience.
A reduction in customer friction is a better predictor of customer loyalty than one exceptional experience at a single touchpoint.

Before the introduction of CES, service delivery organizations were devoting too many resources to creating exceptional experiences at individual touch points (e.g., customer satisfaction on initial contact). These efforts produced no demonstrable ROI and did very little to improve the customer experience. CES is designed to address this shortcoming.
Key Drivers of Customer Effort
Customer effort is driven primarily by the six factors below:
- Consistency and clarity of information
- The need to repeat information
- The length of time the customer is on hold
- First Contact Resolution
- IVR complexity and support structure navigation
- Transfers and channel hopping
Several years ago, Support.com surveyed more than 2,000 U.S. consumers in an effort to understand what connected consumers were most frustrated with during their support experience. The survey (Customer Effort and The Direct Impact on the Brand Relationship) considered touchpoints throughout the entire customer journey—from purchasing and setup, to troubleshooting and upgrading.
The survey revealed that nearly a quarter (24%) of all respondents were frustrated when they were forced to repeat information at each step, 19% were frustrated when they were forced to wait on hold, 19% were frustrated when a representative was not able to resolve the issue on first contact, 15% were frustrated when they were navigating the phone tree, 13% when they were forced to use their valuable time to fix an issue that they did not intend to have, and 11% were frustrated when they were transferred to another representative to get the issue fixed.
Benchmark Data for Customer Effort
Twenty-nine percent of support organizations currently track customer effort. Of these, almost all track at least one other customer experience metric—either customer satisfaction, net promoter, or both. The average CES for IT service desks is 4.12, on a scale of 1–7, with 7 being the best score (i.e., the least effort), while a top quartile score is 6.2 or above.
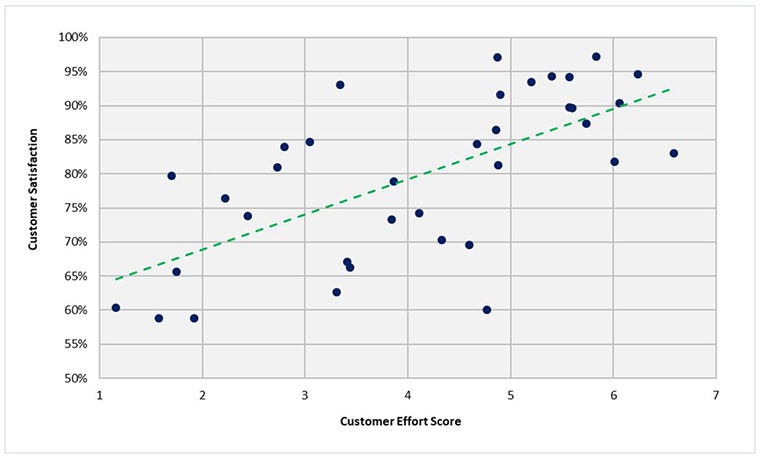
As one might expect, customer effort is correlated with customer satisfaction, but the correlation is somewhat weak, as shown in the diagram below. This is because customer effort and customer satisfaction measure two distinctly different elements of the overall customer experience.
Please join me for next month’s Metric of the Month: Average Speed of Answer, a voice metric that is often misinterpreted.
Jeff will be teaching a two-day workshop, Succeeding with Metrics, at SupportWorld Live!
Join us!
Jeff Rumburg is the winner of the 2014 Ron Muns Lifetime Achievement Award, and was named to HDI’s Top 25 Thought Leaders list for 2018. As co-founder and CEO of MetricNet, Jeff has been retained as an IT service and support expert by some of the world’s largest corporations, including American Express, Hewlett Packard, Coca-Cola, and Sony. He was formerly CEO of the Verity Group and Vice President of Gartner. Jeff received his MBA from Harvard University and his MS in Operations Research from Stanford University. Contact Jeff at
[email protected]
. Follow MetricNet on Twitter @MetricNet.