Date Published January 19, 2021 - Last Updated January 20, 2023
Each month, I highlight one Key Performance Indicator (KPI) for service and support. I define the KPI, provide recent benchmarking data for the metric, and discuss key correlations and cause-and-effect relationships for the metric. The purpose of the column is to familiarize you with the KPIs that really matter to your organization and to provide you with actionable insight on how to leverage these KPIs to improve your performance! This month, I look at ticket backlog.
Ticket backlog is the number of open tickets at a given point in time. It is a general IT support metric that can be measured at any level of support. So, for example, ticket backlog at level 1, desktop support, field services, level 3 IT, and vendor support are all important metrics to track. Additionally, much like a service level metric, there is a time frame associated with most ticket backlog metrics.
For level 1 support, the most common backlog metric is the average ticket backlog as a percent of the average daily ticket volume. So, for example, if a service desk handles an average of 200 tickets a day and the average end-of-day backlog is 10 tickets, the average end of day backlog is 5% of ticket volume (10 open tickets at end of day ÷ 200 average tickets per day = 5% of daily ticket volume). Many service desks have no backlogged tickets because they either resolve or transfer all tickets to another level of support by the end of the day.
For all other levels of support, ticket backlog is measured in both absolute tickets backlogged and backlogged tickets as a percent of monthly volume. Moreover, the backlog is segmented by the age of the ticket. Backlogged tickets less than 10 days old, ticket backlog that is 10–30 days old, and ticket backlog greater than 30 days old are the most common backlog metrics for support levels beyond the service desk.
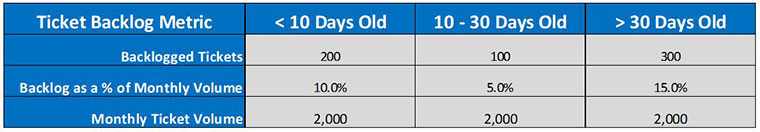
Let’s take the hypothetical example of a field services group that handles 2,000 tickets per month. Let’s further assume that this group has 200 open tickets that are less than 10 days old, 100 tickets that are 10–30 days old, and 300 tickets that are greater than 30 days old. The figure below shows what the ticket backlog report might look like:
Why It’s Important
Ticket backlog tells you a lot about how effectively each level of support is managing their ticket workload. For obvious reasons, a lower ticket backlog is better than a higher ticket backlog. Some ticket backlog is to be expected. Additionally, there are numerous legitimate reasons that some tickets might be backlogged. But a high number of tickets backlogged at a given support level, particularly backlogged tickets greater than 30 days old, is an indication that discipline and accountability have broken down when it comes to ticket management.
In the ticket backlog report above, I would be particularly concerned about the volume of backlogged tickets that are greater than 30 days old. In general, there should be fewer backlogged tickets as they age. So, the fact that the largest volume of backlogged tickets is greater than 30 days old is a concern.
Understanding the reasons behind the ticket backlog can be a laborious process, but one that is worth undertaking. It involves organizing the open tickets by ticket owner and simply asking each ticket owner for an explanation of their backlogged tickets. Here are some of the common reasons given for tickets backlogged that are more than 30 days old.
- Finished the ticket but never closed it
- Waiting for the customer to get back to me
- Didn’t know the ticket was in my queue
- Don’t know how to resolve the ticket
- Thought I had reassigned the ticket
- Waiting for parts to arrive
These are not meant to be humorous, nor are they hypothetical. These really are the most common reasons I hear for backlogged tickets that are more than 30 days old. So, here is how I would address each one:
-
Finished the ticket but never closed it: Close every ticket when completed. Open tickets will come up in your performance review.
-
Waiting for the customer to get back to me: Pause the ticket, and contact the customer once a week. If the customer doesn’t get back to you, close the ticket.
-
Didn’t know the ticket was in my queue: Watch your ticket queue more carefully.
-
Don’t know how to resolve the ticket:
Get help, or escalate the ticket!
-
Thought I had reassigned the ticket:
Watch your ticket queue more carefully.
-
Waiting for parts to arrive:
Pause the ticket, and contact the vendor and the customer once a week.
As you can see, this isn’t rocket science. It is simply a matter of reinforcing the importance of good ticket management practices and driving accountability.
Benchmark Data for Ticket Backlog
Although most ITSM systems can easily report on ticket backlog by age, support level, assignment group, and individual, it is surprising how few IT support organizations track this metric. For that reason, the benchmarking data around backlogged tickets is somewhat sparse. However, as a guideline, the table below summarizes the approximate backlog performance targets for those IT support organizations that perform in the top quartile of the industry.
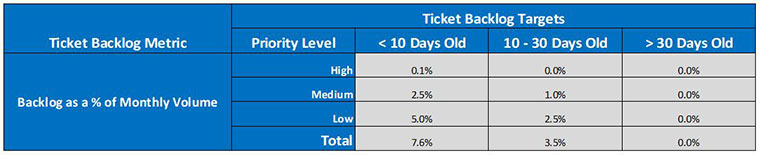
What is particularly noteworthy is that tickets older than 30 days are considered unacceptable. They are simply not tolerated. The target for backlogged tickets older than 30 days is zero!
If you have never tracked this metric, or you do not have performance targets for backlogged tickets, you might want to start with a less aggressive set of targets. Likewise, your ticket priority matrix may include two criteria: urgency and impact, for example. The point is that you don’t have to adopt the targets presented in the table above, but you should establish some target performance level for your backlogged tickets.
Managing Ticket Backlog
Backlogged tickets have a tendency to creep up over time if not actively managed. The best way to raise awareness and drive accountability for backlogged tickets is to publish a weekly or monthly report that lists the ticket owners and the number of backlogged tickets in each age category. Additionally, these reports are generally sorted in descending order according to the number of backlogged tickets. Nobody wants to see their name near the top of that report! The mere act of publishing a ticket backlog report oftentimes has the effect of reducing ticket backlog by 50% or more!
Publishing a ticket backlog report oftentimes has the effect of reducing ticket backlog by 50% or more!

Please join me next month for Metric of the Month: Ticket Quality, a service desk and desktop support metric that has gained widespread acceptance in recent years and has profound implications for ITIL practices such as incident, problem, and knowledge management.
Jeff Rumburg is the winner of the 2014 Ron Muns Lifetime Achievement Award, and was named to HDI’s Top 25 Thought Leaders. As co-founder and CEO of MetricNet, Jeff has been retained as an IT service and support expert by some of the world’s largest corporations, including American Express, Hewlett Packard, Coca-Cola, and Sony. He was formerly CEO of the Verity Group and Vice President of Gartner. Jeff received his MBA from Harvard University and his MS in Operations Research from Stanford University. Contact Jeff at
[email protected]
. Follow MetricNet on Twitter @MetricNet.