Date Published May 8, 2018 - Last Updated December 13, 2018
Each month, I highlight one Key Performance Indicator (KPI) for service and support. I define the KPI, provide recent benchmarking data for the metric, and discuss key correlations and cause-and-effect relationships for the metric. The purpose of the column is to familiarize you with the KPIs that really matter to your organization and to provide you with actionable insight on how to leverage these KPIs to improve your performance! This month, I focus on mean time to resolve.
Incident mean time to resolve (MTTR) is a service level metric for both service desk and desktop support that measures the average elapsed time from when an incident is opened until the incident is closed. It is typically measured in business hours, not clock hours. An incident that is reported at 4:00 p.m. on a Friday and closed out at 4:00 p.m. the following Monday, for example, will have a resolution time of eight business hours, not 72 clock hours. Most ITSM systems can easily measure and track MTTR.
My examples in this Metric of the Month will focus on desktop support, but the MTTR metric is equally applicable to the service desk. Please note that I make a distinction between incidents and service requests. A desktop incident is typically unplanned work that requires the assistance of an on-site technician to resolve. Common examples include break/fix requests for a laptop computer, a printer or server failure, connectivity problems, or other issues that cannot be resolved remotely by the level 1 service desk. By contrast, most desktop service requests represent planned work. Among the most common desktop service requests are move/add/changes, hardware refresh/replacement, and device upgrades. MTTR as discussed in this article refers specifically to incidents, not service requests.
Why It’s Important
As you know from prior Metric of the Month articles, service levels at level 1, including average speed of answer and call abandonment rate, are relatively unimportant. They have little influence on customer satisfaction. The same, however, cannot be said of service levels for desktop support. In fact, MTTR is one of the key drivers of customer satisfaction for desktop support. This makes sense, as a user may be completely down or forced to use workarounds until their incident has been resolved. This, in turn, has a significant impact on their overall satisfaction with desktop support.
Mean time to resolve is one of the key drivers of customer satisfaction for desktop support.

The figure below shows the relationship between customer satisfaction and incident MTTR for a representative cross-section of global desktop support groups. The strong correlation between MTTR and customer satisfaction is readily apparent.
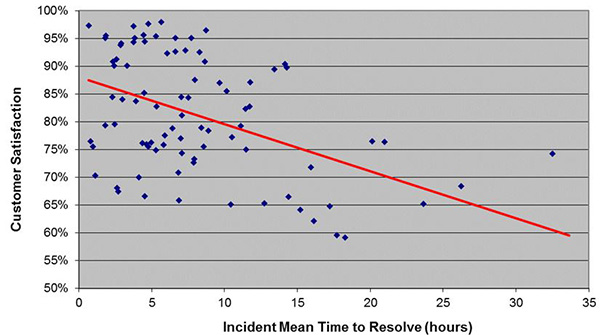
Inasmuch as customer satisfaction is driven by MTTR, many desktop support organizations take steps to actively manage this metric. Although the user population density and hence the travel time per incident cannot be controlled, other factors affecting MTTR can be managed. These include maximizing the first visit resolution rate (comparable to first contact resolution rate at level 1) and routing desktop technicians in real time. This latter technique allows an organization to effectively manage the incident queue by dispatching and assigning technicians based on the proximity, urgency, and geographic clustering of incidents rather than on a first-in-first-out (FIFO) basis, as is common in the industry. This has been shown to significantly reduce the MTTR for desktop support incidents.
Benchmark Data for Incident MTTR
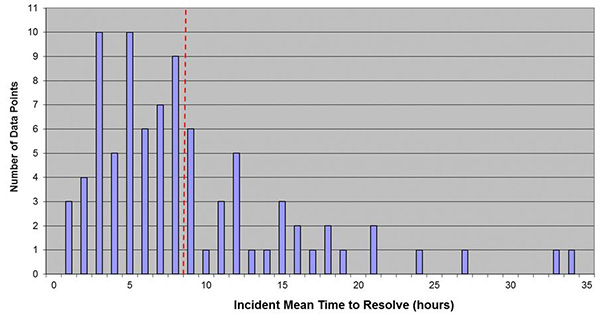
Industry data from MetricNet’s global benchmarking database shows that the average incident MTTR is 8.40 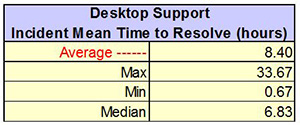 business hours, but ranges widely, from a high of 33.67 hours to a low of 0.67 hours (shown in the figures). This wide variation is driven by several factors including the ticket backlog, user population density, which impacts travel time per ticket, and the complexity of tickets handled, which impacts the work time per ticket.
In a high-density user environment such as a high-rise office building with lots of cubicles, the technician travel time to and from the site of an incident is generally short (e.g., less than 10 minutes). This results in shorter MTTRs. By contrast, technician travel time for users who are spread out over a broader geographical area (think desktop support for a retail bank with many branches in a given region) is often significantly greater and will increase the MTTR accordingly. Likewise, more complex tickets result in longer work times and correspondingly higher MTTRs.
As with level 1 service levels, performance targets are generally established for desktop support MTTR. Due to variations in desktop environments from one organization to another, there is no standard performance target for MTTR. Nevertheless, some of the more common performance targets include 80 percent of incidents resolved same day/next day, and 80 percent of incidents resolved in 8 business hours or 24 clock hours.
Join me for my next Metric of the Month article, where I will explore the cause-and-effect relationships for desktop support KPIs.
Jeff Rumburg is the winner of the 2014 Ron Muns Lifetime Achievement Award, and was named to HDI’s Top 25 Thought Leaders list for 2016. As co-founder and CEO of MetricNet, Jeff has been retained as an IT service and support expert by some of the world’s largest corporations, including American Express, Hewlett Packard, Coca-Cola, and Sony. He was formerly CEO of the Verity Group and Vice President of Gartner. Jeff received his MBA from Harvard University and his MS in Operations Research from Stanford University. Contact Jeff at
[email protected]
. Follow MetricNet on Twitter @MetricNet.