Date Published August 29, 2019 - Last Updated December 17, 2019
Each month, I highlight one Key Performance Indicator (KPI) for service and support. I define the KPI, provide recent benchmarking data for the metric, and discuss key correlations and cause-and-effect relationships for the metric. The purpose of the column is to familiarize you with the KPIs that really matter to your organization and to provide you with actionable insight on how to leverage these KPIs to improve your performance!
This month, I depart from our usual format, and instead of discussing a single metric, I will explain how to combine three critical metrics to create a single, overall measure of Customer Experience (CX).
If you Google the definition for Customer Experience, it returns an overwhelming number of whitepapers, books, and articles on the topic, each with varying interpretations. This points to one inescapable conclusion: there is still no industry standard definition for CX!
As many of you know, I’ve been in the IT service and support industry for nearly 30 years. During that time, I’ve had the good fortune to work with more than half of the Global 2000 on countless performance measurement and management initiatives, including benchmarking, metrics maturation, and continual service improvement. We now track more than 70 key performance indicators (KPIs), many of which didn’t even exist when I started in the industry. This is important because as IT service and support evolves, so too should the metrics we measure. For example, the introduction of alternate channels such as chat and AI has led to an entirely new category of metrics that are channel specific. By the same token, it’s important to have a precise, objective definition of CX.
Join Jeff for an ROI workshop at Service Management World 2019.
Join us!
Defining Customer Experience
To develop a valid methodology to measure CX, we must first understand what CX really is and why it’s important. Think of the customer experience as a marathon, not a sprint. Each touchpoint with your customer is a mile marker, and they all influence customer perception. Moreover, customer perception is everything! It’s also critical to understand that not every touchpoint involves live agent interaction. We must consider the end-to-end journey a customer takes when engaging IT support, including the level of effort expended and the time it takes to reach the desired outcome.
Think of the customer experience as a marathon, not a sprint.

Much like MetricNet’s ROI methodology, we start by breaking customer experience into its respective parts to get a single overall measure of performance. There are three critical metrics that comprise the customer experience: Customer Satisfaction, Customer Effort, and Net Promoter Score. How did we arrive at these three metrics? Is it a hunch? Suspicion? An academic exercise? No, it’s none of the above. We know that these are the three metrics that matter most because the empirical evidence from thousands of service and support benchmarks supports this conclusion. But let me explain why these metrics are so critically important.
The Three Most Important CX Metrics
Customer Satisfaction. Customer Satisfaction is by far the most common measure of quality. It is widely used, not just in IT service and support, but in all industries. It is so ubiquitous that most of us have probably been surveyed within the last week, by our bank, an airline, our insurance company, a hotel, or some other service provider. The metric is so common that most have an intuitive feel for customer satisfaction. We know, for example, that a customer satisfaction score of 70% is probably not very good, while a customer satisfaction score of greater than 90% is very good indeed!
Customer Satisfaction is the percentage of customers who are either satisfied or very satisfied with the quality of support they receive. It is equally applicable to the service desk and desktop support and is the single most important measure of quality for a support organization.
Customer Effort Score. Customer Effort Score (CES) was first introduced in 2008 by the Corporate Executive Board (CEB). CEB’s research demonstrated that a reduction in customer friction was a better predictor of customer loyalty than one exceptional experience at a single touchpoint. In fact, CEB found that 81% of customers going through a high level of effort are likely to share their bad experience with friends vs. only 1% of those who went through an effortless experience.
Before the introduction of CES, service delivery organizations were devoting too many resources to creating exceptional experiences at individual touch points (e.g., customer satisfaction on initial contact). These efforts produced no demonstrable ROI and did very little to improve the customer experience. CES is designed to address this shortcoming by asking the following question: How easy was it to get the resolution you wanted today? Measured on a scale of 1–7, a CES score of 1 indicates an extremely difficult experience and a CES score of 7 indicates an effortless experience.
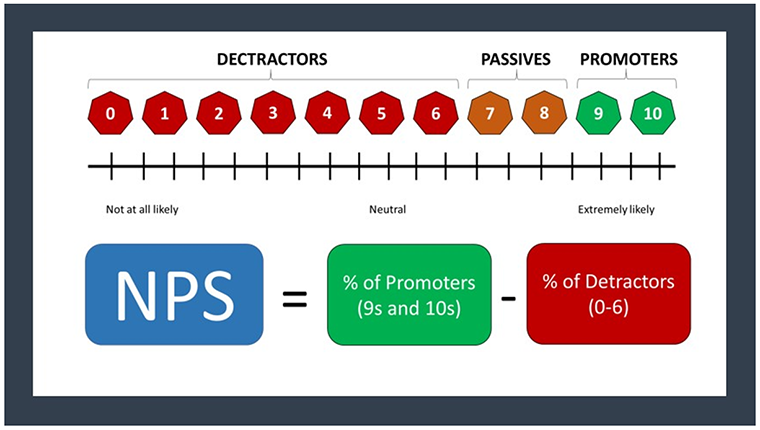
Net Promoter Score. Net Promoter Score, or NPS, is based on the idea that every organization’s customers can be divided into three categories: Promoters, Passives, and Detractors. By asking one question—How likely is it that you would recommend our service to a friend or colleague?—you can track these groups and get a clear measure of your support organization’s performance from the customer’s perspective. Customers respond on a 0-to-10-point rating scale, categorized as follows:
-
Promoters (score 9–10) are loyal enthusiasts who will refer others to your support organization.
-
Passives (score 7–8) are satisfied but unenthusiastic customers who may choose another source of support if given the chance.
-
Detractors (score 0–6) are unhappy customers who can damage your reputation through negative word-of-mouth.
To calculate your support group’s NPS, simply take the percentage of customers who are Promoters and subtract the percentage who are Detractors. Your Net Promoter score can be as low as −100% (everybody is a Detractor) or as high as +100% (everybody is a Promoter). An NPS that is positive (i.e., higher than zero) is thought to be good, and an NPS of +50% or greater is excellent.
IT support groups that track NPS, much like CES, will typically follow the initial question with an open-ended request for elaboration, soliciting the reasons for a customer's rating of their IT support. These insights can then be provided to front-line employees and management teams for follow-up action and improvement initiatives.
NPS is a relatively new metric. Currently, only about 25% of all service desks and desktop support groups track this metric. However, the majority of organizations tracking NPS are providing support to external businesses or consumers, where NPS is viewed as a leading indicator of customer loyalty and follow-on business. This would include hardware and software vendors who use NPS to gauge customer loyalty, as well as managed service providers who want to know if you are likely to recommend their services to others.
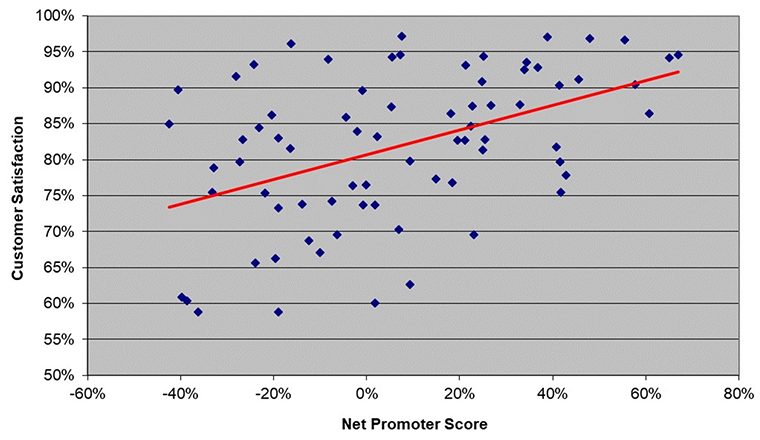
MetricNet’s benchmarking data for customer satisfaction and net promoter scores is shown in the figure below for 74 IT support organizations that track both metrics. As you can see, the customer satisfaction score for this particular data set is always higher than the Net Promoter score. This is generally the case, as it is extremely rare for an organization to have a higher NPS than customer satisfaction score. Put another way, it is much easier to create a satisfied customer than it is to create a customer who is willing to put their credibility on the line by recommending your service!
A Proposed CX Indicator
By combining CSAT, CES, and NPS, we can calculate an overall Customer Experience score. Creating your CX score in Excel is relatively straightforward. You can follow along in the figure below as I explain the process, and you can download an Excel template for generating your own CX score.
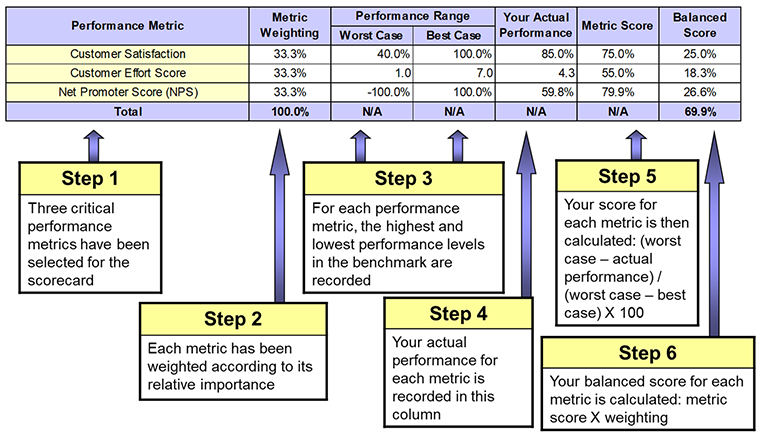
The first step in calculating your CX score is to select the metrics to include in your scorecard: CSAT, CES, and NPS. Secondly, you establish a weighting for each metric based upon its relative importance in the scorecard. This is a judgment call, but we suggest an equal weighting for the three metrics that comprise Customer Experience. Step 3 is to show a reasonable range of performance—worst case to best case—for each metric. Normally these performance ranges are derived from a benchmark of your service desk or desktop support group. In step 4, your performance for each metric is inserted into the third column from the right. A score for each metric is then calculated based on the interpolation formula in step 5. Finally, a balanced score for each metric is determined by multiplying the metric weighting by the metric score. When the balanced scores for each of the CX metrics are summed up, you have the Customer Experience score for your support organization!
In this example, the CX score is 69.9%. Your CX score will always range from 0% (if you have the worst possible performance for CSAT, CES, and NPS) to 100% (if you have the best possible performance for every CX metric). It turns out that the service desk in our example has scored quite well. When we run hundreds of IT service and support organizations through this algorithm, we get a normal distribution centered right at 50%. Those who score above 65% are typically in the top quartile for CX; those who score between 50% and 65% are in the second quartile; those between 35% and 50% are in the third quartile; and those below 35% are generally in the bottom quartile for overall CX performance.
Now that you have a methodology for measuring Customer Experience, I encourage to put this knowledge to good use. The first step is to begin tracking the three metrics that comprise CX: Customer Satisfaction, Customer Effort, and Net Promoter Score. From there, it is a simple calculation to determine your overall CX score.
Please join me for next month’s Metric of the Month: The Agent Scorecard, where I will discuss a methodology for measuring and managing individual agent performance.
Jeff Rumburg is the winner of the 2014 Ron Muns Lifetime Achievement Award, and was named to HDI’s Top 25 Thought Leaders list for 2018. As co-founder and CEO of MetricNet, Jeff has been retained as an IT service and support expert by some of the world’s largest corporations, including American Express, Hewlett Packard, Coca-Cola, and Sony. He was formerly CEO of the Verity Group and Vice President of Gartner. Jeff received his MBA from Harvard University and his MS in Operations Research from Stanford University. Contact Jeff at
[email protected]
. Follow MetricNet on Twitter @MetricNet.