Date Published December 30, 2020 - Last Updated January 20, 2023
Best of HDI in 2020 - #1
Each month, I highlight one Key Performance Indicator (KPI) for service and support. I define the KPI, provide recent benchmarking data for the metric, and discuss key correlations and cause-and-effect relationships for the metric. The purpose of the column is to familiarize you with the KPIs that really matter to your organization and to provide you with actionable insight on how to leverage these KPIs to improve your performance! This month, I look at tickets prevented.
“The best ticket is the ticket that never happens!” I first heard this truism nearly 30 years ago when I got started in this industry. And today, it’s even more true than ever before! Preventing a ticket altogether is always better than handling a ticket that has been triggered by an incident or a service request. But can we prevent tickets from happening, and is there a way to measure tickets prevented? The answer to both questions is, Yes! So, let’s take a deeper dive into tickets prevented.
Preventing a ticket altogether is always better than handling a ticket that has been triggered by an incident or a service request.

Measuring tickets prevented starts by measuring another, baseline metric, tickets per user per month, which I wrote about in another Metric of the Month. As the name suggests, this metric is calculated by simply dividing the number of tickets handled by the number of users supported. Let’s say, for example, that we handle 10,000 tickets in a given month and support 8,000 users. The number of tickets per user per month is simply (10,000 tickets ÷ 8,000 users) = 1.25 tickets per user per month.
Now let’s assume that we measure tickets per user per month a year later at the same service desk and find that we are handling 9,000 tickets and supporting 8,500 users. The tickets per user per month is now (9,000 tickets ÷ 8,500 users) = 1.06 tickets per user per month. The number of tickets per user per month has been reduced by 0.19 (1.25 – 1.06 tickets per user per month). Finally, to estimate how many tickets are being prevented each month we can multiply the reduction in tickets per user per month by the number of users supported: (0.19 tickets per user per month prevented x 8,500 Users) = 1,615 tickets prevented per month vs. the baseline from one year earlier.
Why It’s Important
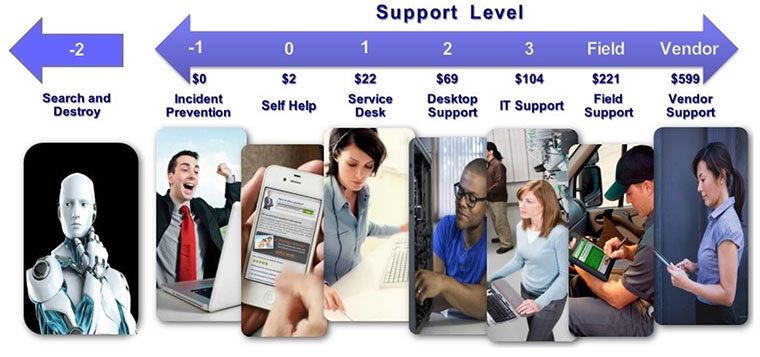
Last year in North America, the average cost of resolving a ticket at level 1 was about $22, while the average cost of a desktop support ticket was almost $70 (illustrated in the figure below). To continue with our prior example, 1,615 level 1 tickets prevented per month will save an estimated $35,530 per month in direct support costs (1,615 tickets prevented x $22 per ticket) or $426,360 per year!
But there is another, more important benefit, to consider here. And that is the time savings of users who avoid these tickets. In one study conducted by MetricNet, it was estimated that an avoided level 1 ticket saves the user/customer about 20 minutes of productive time on average. This time savings can be monetized, and it turns out that the economic value of the productive time returned to the customer is about twice the direct cost of a level 1 ticket. So, if we are saving $22 in direct cost for every level 1 ticket prevented, we are returning an estimated $44 in productive time to each user who avoids the ticket altogether. Once again, continuing with our example, 1,615 tickets prevented are worth an estimated $106,590 per month in economic value to the enterprise (1,615 tickets prevented x ($22 direct savings per ticket + $44 in user productivity saved). This, in turn, equates to an estimated savings of $1.28 million per year!
Reducing Ticket Volumes
There is an entire ITIL discipline devoted to preventing tickets. It’s called problem management. I have literally seen examples of large enterprises that have cut their ticket volumes in half by maturing problem management, saving millions per year in the process. Some have argued that an effective self-help portal can also reduce ticket volumes. While self-help can reduce the number of agent-assisted tickets, it is debatable whether it returns productive time to the end-user. As a general rule of thumb, a user should not be spending more than 10 minutes at a time in the self-help portal. Any more than 10 minutes spent in self-help, even if the user eventually finds a workable solution, ends up costing the enterprise more in lost productivity than it saves in direct support costs.
Other factors that can reduce ticket volumes include effective change and release management; both are ITIL disciplines. Effective user training, virtualization, and standard device imaging have also been shown to decrease the number of tickets generated by a given user population.
Finally, an increasing number of support organizations are deploying “search and destroy” technologies that preemptively eliminate hardware, software, and user issues. For example, these technologies can identify servers and hard drives that are on the verge of failure and repair or replace them. They can even identify users who may need some training or coaching (e.g., for too many calls to the support desk, too many password resets, or even the need for remedial desktop application training). As shown in the diagram above, this preemptive support is often referred to as level 2 support.
Benchmark Data for Tickets Prevented
Approximately 15% of IT support organizations track tickets prevented, but the adoption rate of the metric is growing rapidly. The number of tickets generated by an organization is driven by numerous factors including the average age of devices supported, the mix of laptop and desktop computers, the number of remote users, the number of mobile devices, the refresh rate of devices, the standardization (or lack thereof) of the IT environment, and the degree of virtualization. The average number of level 1 tickets per user per month is about 1.30, while the average number of desktop support tickets per user per month is about 0.41.
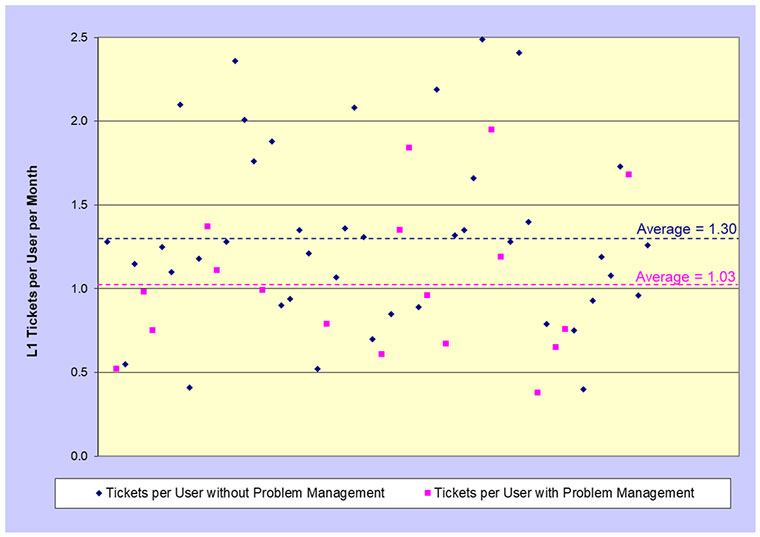
More importantly, empirical data from MetricNet benchmarks shows that the average number of level 1 tickets per user per month is significantly lower for organizations that have an active (and effective) problem management discipline, illustrated the in the figure below.
Please join me for next month’s Metric of the Month: Schedule Adherence, a metric that has far-reaching implications for agent productivity, service levels, and cost per ticket.
Jeff will be teaching a two-day workshop, Succeeding with Metrics, at SupportWorld Live!
Join us!
Jeff Rumburg is the winner of the 2014 Ron Muns Lifetime Achievement Award, and was named to HDI’s Top 25 Thought Leaders list for 2018. As co-founder and CEO of MetricNet, Jeff has been retained as an IT service and support expert by some of the world’s largest corporations, including American Express, Hewlett Packard, Coca-Cola, and Sony. He was formerly CEO of the Verity Group and Vice President of Gartner. Jeff received his MBA from Harvard University and his MS in Operations Research from Stanford University. Contact Jeff at
[email protected]
. Follow MetricNet on Twitter @MetricNet.