Each year we ask in our Support Center Practices & Salary Survey, “Do you measure incidents and service requests separately?” The numbers have changed quite a bit in the past few years. In 2013, for example, only 39 percent of respondents (n=754) said they do measure each separately; about one-quarter distinguished between incidents and requests but did not measure them separately. Thirty-six percent said they did not distinguish between incidents and requests at all.
In the HDI 2015 Support Center Practices & Salary Report, we published the following result:
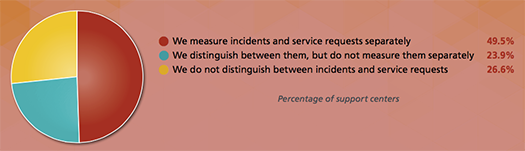
Although the percentage of support centers that distinguish but don’t measure has changed very little, there has been a roughly even swing on each end of the spectrum. Those who measure separately increased by about 10 percent, and those who do not distinguish decreased by about the same amount.
Why Is This Important?
We often hear about how much time support centers spend just to “keep the lights on.” In fact, there’s even an acronym for that: KTLO. Incidents represent unplanned or interrupt-driven work. The percentage of total work that represents incidents—when something is broken—is a good indicator of this “firefighting” or KTLO mode.
Service requests, on the other hand, represent work that—for the most part—can be planned. When a new employee is about to arrive, for example, a series of things happen in sequence: A computer is provisioned, levels of access are set, an email account is set up, and so on. This onboarding process and the approvals attendant to it are carried out according to a standard workflow that is predictable, for the most part. At least some of that workflow can be automated, but only if the request is initiated as such and not as a generic “ticket.”
While it is very important for support to get users back to work by resolving incidents as rapidly as possible (measured by mean time to restore service and/or mean time to resolve) it is important to fulfill service requests on time. No one wants to start a new job without a computer and the appropriate software and other IT resources, for example.
Incidents Are the Report Card of IT
Over time, the general trend of the volume of incidents should be downward. As IT improves, fewer things should be breaking, and an upward trend in incidents indicates otherwise. Just counting both incidents and requests as “tickets” doesn’t help to illustrate the health of IT.
Counting both incidents and requests as “tickets” doesn’t illustrate the health of IT.

In the organizations that do measure incidents and requests differently, this was the 2015 breakdown:
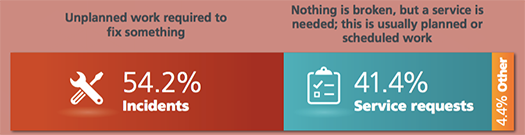
Source: HDI 2015 Support Center Practices & Salary Report
What this is really saying is that support is spending well more than half its time just keeping up with things that are breaking. Imagine if you will, working on a home project where this happened: More than half your time was spent just fixing broken tools, wires, outlets, and so on as you were trying to complete your project. You would not be able to make substantial progress. The same is true in so many companies or organizations. Too much KTLO and not enough progress. By breaking out incidents and requests, you can show your business how much time (and resources) are being expended doing “cleanup on aisle 5” instead of stocking the shelves.
Once you have separated incidents and requests from each other, it becomes far easier to begin analyzing the types of incidents, their frequency, their duration, and lots of other information. On the request side, you have a much better idea what volume of work can be planned.
Comingling incidents and service requests also skews metrics to an extent. In the case of first level resolution (FLR) (i.e., resolving an issue without escalation), the industry average for incidents is 68 percent (target = 70.4 percent) in organizations that measure separately, and 74.9 percent in organizations that don’t. This appears to make the organizations that don’t measure incidents and requests separately look better; but in fact, the target for FLR in those organizations is 82.2 percent—meaning they are missing their target by an average of 7.3 percent. In the organizations that do measure separately, the target is 70.4 percent FLR for incidents, so they are missing their target, on average, by only 2.4 percent.
To sum up, if you are not measuring incidents and service requests separately, start doing it. It’s a big step on the road to better support and service management.
Not an HDI member? You can request an excerpt of the HDI 2015 Support Center Practices & Salary Report here.
Roy Atkinson is HDI's senior writer/analyst, acting as in-house subject matter expert and chief writer for SupportWorld articles and white papers. In addition to being a member of the HDI International Certification Standards Committee and the HDI Desktop Support Advisory Board, Roy is a popular speaker at HDI conferences and is well known to HDI local chapter audiences. His background is in both service desk and desktop support as well as small-business consulting. Roy is highly rated on social media, especially on the topics of IT service management and customer service. He is a cohost of the very popular #custserv (customer service) chat on Twitter, which celebrated its fifth anniversary on December 9, 2014. He holds a master’s certificate in advanced management strategy from Tulane University’s Freeman School of Business, and he is a certified HDI Support Center Manager. Follow him on Twitter @HDI_Analyst and @RoyAtkinson.