Date Published August 9, 2017 - Last Updated April 19, 2019
Each month, I highlight one Key Performance Indicator (KPI) for service and support. I define the KPI, provide recent benchmarking data for the metric, and discuss key correlations and cause-and-effect relationships for the metric. The purpose of the column is to familiarize you with the KPIs that really matter to your organization and to provide you with actionable insight on how to leverage these KPIs to improve your performance. This month, I tackle agent utilization.
One goal of every business is to achieve the highest possible quality at the lowest possible cost. It stands to reason, therefore, that cost and quality should be measured on an ongoing basis. In fact, many would argue that cost and quality are the only two things that really matter in a service desk. In past articles, I’ve discussed the importance of using metrics as a diagnostic tool to improve performance. So, we must ask ourselves, if cost per ticket is one of the foundation metrics for the service desk, how can we affect it? How can we improve it? What are the primary levers we have to manage cost?
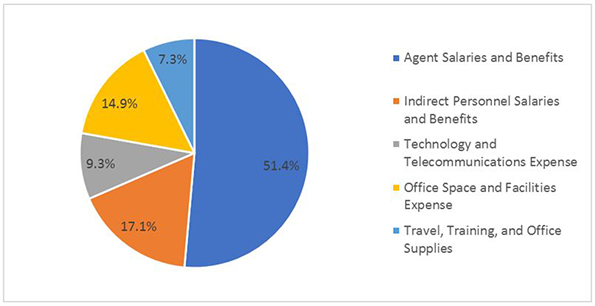
The service desk is a labor-intensive function. Agent salaries and benefits make up more than half of all costs for the average service desk. And when you consider the salaries and benefits for non-agents, (e.g. supervisors, team leads, QA/QC, trainers, and workforce schedulers) approximately two thirds of all service desk costs are personnel related, as shown in Figure 1 below.
The service desk is a labor-intensive function.

Labor productivity is therefore the most effective lever we have to manage and control service desk costs, and the best measure of labor productivity is agent utilization. Agent utilization is simply the ratio of work produced divided by work capacity. So, for example, if an agent is working on tickets for five hours out of an eight hour shift, the utilization for that day would be 62.5% (5 hours of work produced ÷ 8 hours capacity).
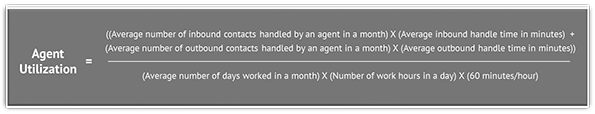
The formula for determining agent utilization is somewhat complicated. It factors in the hours in a work day, break times, vacation and sick days, training time, and a few other variables. But there is an easy way to approximate agent utilization without going to so much trouble. The simplified formula is shown below:
Let’s say, for example, that the agents in a particular service desk handle an average of 375 inbound contacts per month at an average handle time of 10 minutes per contact and make 225 outbound contacts per month at an average handle time of 5 minutes per contact. Additionally, these agents work an average of 21.5 days per month, and their work day is 7.5 hours after subtracting lunch and break times. The simplified utilization formula above would work out to the following:
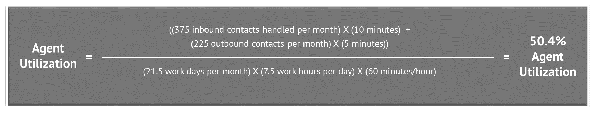
Once again, this is not a perfect measure of agent utilization, but it is quick and easy and gets you within 5% of the true agent utilization figure.
Why It’s Important
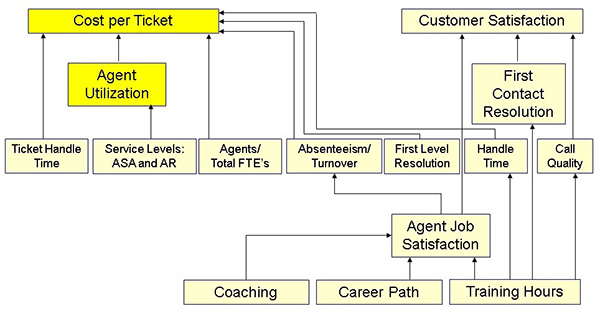
Since agent salaries and benefits represent more than half of all service desk costs, if agent utilization is high, the cost per contact will be correspondingly low. Conversely, when agent utilization is low, agent costs, and hence cost per ticket, will be correspondingly high. The first figure below shows how agent utilization fits into our KPI cause-and-effect diagram, while the following figure below shows the relationship between agent utilization and cost per ticket.
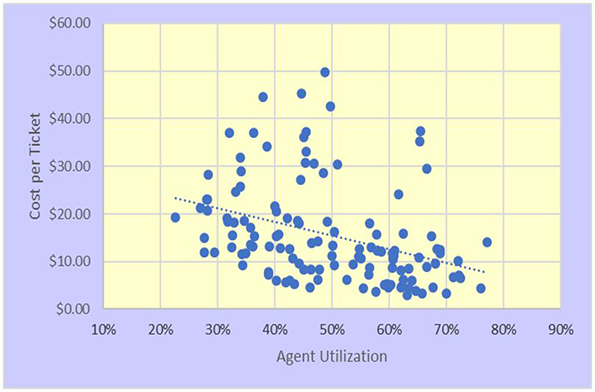
Just as world-class service desks are obsessive about maintaining high customer satisfaction levels, they are equally committed to keeping their costs in check. They do this primarily by maintaining tight control over agent utilization. This has the effect of minimizing cost per ticket as illustrated above. That said, extremely high agent utilization can actually increase your costs by driving agent turnover and absenteeism higher. Whenever agent utilization rates approach 60–70 percent, a service desk will experience relatively high agent turnover because they are pushing the agents too hard. Extremely high utilization leads to burnout, higher turnover, higher absenteeism, and lower morale in the service desk.
Key Drivers of Agent Utilization
A key driver of agent utilization is service levels. The more aggressive your service levels are, the lower the utilization will be because quicker response times require greater headcount. Other factors that impact utilization include the number of languages supported by the desk, the amount of project work assigned to agents, the hours of operation for the service desk, and scheduling efficiency.
Service desks that support multiple languages tend to have lower utilization rates than service desks that support a single language. This is because separate language queues create diseconomies of scale. Likewise, project work takes agents off the phone, email, or chat lines, and will reduce agent utilization. Service desks that operate 24x 7 generally have lower utilization than desks that do not provide round-the-clock support because weekend and overnight shifts tend to be low volume and produce correspondingly low agent utilization.
Finally, at the risk of stating the obvious, some service desks are simply overstaffed or understaffed. Overstaffing leads to low utilization and high costs, while understaffing leads to high utilization and lower costs.
Benchmarking Ranges for Agent Utilization
The global averages and ranges for agent utilization for the first half of 2017 are shown below.
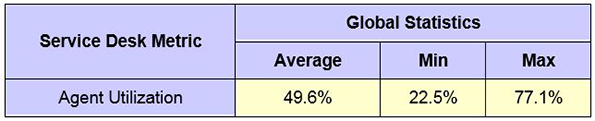
The ranges for agent utilization (min to max) are quite large. The reasons for this have been explained above and include scheduling efficiency, over or under staffing, hours of operation, and languages supported.
Please join me for next month’s Metric of the Month: Agent Job Satisfaction, a metric that has a secondary impact on almost every other metric in service and support.
Jeff Rumburg is the winner of the 2014 Ron Muns Lifetime Achievement Award, and was named to HDI’s Top 25 Thought Leaders list for 2016. As co-founder and CEO of MetricNet, Jeff has been retained as an IT service and support expert by some of the world’s largest corporations, including American Express, Hewlett Packard, Coca-Cola, and Sony. He was formerly CEO of the Verity Group and Vice President of Gartner. Jeff received his MBA from Harvard University and his MS in Operations Research from Stanford University. Contact Jeff at
[email protected]
. Follow MetricNet on Twitter @MetricNet.