Date Published September 25, 2019 - Last Updated December 17, 2019
Each month, I highlight one Key Performance Indicator (KPI) for service and support. I define the KPI, provide recent benchmarking data for the metric, and discuss key correlations and cause-and-effect relationships for the metric. The purpose of the column is to familiarize you with the KPIs that really matter to your organization and to provide you with actionable insight on how to leverage these KPIs to improve your performance!
This month, I depart from my usual format, and instead of discussing a single metric, I will explain how a handful of critical metrics can be combined to create a single, overall measure of individual agent performance. We call this the Agent Balanced Scorecard.
The Agent Balanced Scorecard
An increasing number of progressive IT support organizations recognize that when it comes to performance metrics, driving agent accountability really matters! They have discovered that clear and quantifiable agent performance targets have enormous benefits for both agents and the service desk overall. These include, but are not limited to, greater visibility and accountability into agent performance, improved ability to coach agents in areas were improvements are needed, and dramatically improved performance for both agents and the service desk overall. In fact, MetricNet’s research shows that establishing a single, unified performance metric for your agents is critical to achieving world-class performance. We call this metric the agent balanced score because it truly does communicate a balanced picture of agent performance.
The agent balanced scorecard is a mechanism that aggregates a critical set of metrics that are indicative of agent performance—such as tickets per agent per month, first contact resolution, and customer satisfaction—and combines them into a single, all-inclusive measure of agent performance. The value of this metric, when tracked over time, is that it allows you to ascertain whether individual agent performance is improving and how each individual agent can maximize their performance.
Virtually every support organization that we work with now uses some variation of this tool to drive accountability at an individual level within the organization, and the best part is, it’s easy to get started! The overall service desk scorecard that MetricNet recommends for service and support organizations can be used as a template for the individual agent scorecard since the mechanics of creating both scorecards are identical.
Think of the agent balanced score as a monthly performance indicator for each of your agents. In this way, service desk agents can track their overall performance and in any given month might see customer satisfaction go up or first contact resolution go down. But these individual measures take on a secondary level of importance because the agent balanced score provides a more complete and accurate picture of overall agent performance.
Join Jeff for an ROI workshop at Service Management World 2019.
Join us!
Creating an Agent Scorecard
In one recent project I managed for a financial services company, agent scorecards were implemented in an effort to drive improved performance for both level 1 support and field services. The scorecard, shown below, contained just three metrics: customer satisfaction (a quality metric), tickets handled per month (a productivity metric), and first contact resolution rate (an effectiveness metric). These three metrics drive the right agent behaviors and enable supervisors to provide targeted feedback to each agent on a monthly basis (sample below).
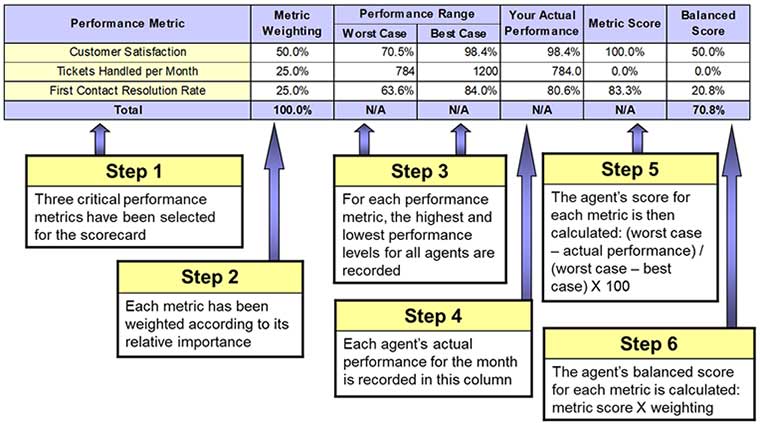
Depending on the metrics you track in your service desk, you may choose more metrics or a different mix of metrics for your agent scorecard. Once you select the metrics for the agent scorecard, establish a weighting for each metric based on its relative importance. Step 3 is to show a reasonable range of performance—worst case to best case—for each metric. Typically, these performance ranges are adjusted monthly, based on the worst and best agent performance in the service desk. In step 4, the agent’s actual performance for each metric is inserted into the third column from the right. A score for each metric is then calculated based on the interpolation formula in step 5. And finally, a balanced score for each metric is determined by multiplying the metric weighting by the metric score. When the balanced scores for each metric are summed up, you have the total monthly balanced score for the agent!
In this example, the agent’s balanced score is excellent, at 70.8%! Every agent’s balanced score will always range from 0% (if they have the worst possible performance for every metric in the scorecard) to 100% (if they have the best possible performance for every metric in the scorecard). It turns out that the agent in our example has scored quite well. When we run hundreds of service desk agents through this algorithm, we get a normal distribution centered right at 50%. Those who score above 60% are typically in the top quartile; those who score between 50% and 60% are in the second quartile; those between 40% and 50% are in the third quartile; and those below 40% are generally in the bottom quartile for overall agent performance.
Once again, the ranges on the scorecard should represent all agents in the service desk. That way, each agent can see how they rank relative to their peers in service and support. Let's say, for example, that you have 20 agents and the lowest performer on Tickets Handled per Month handles 80 tickets, and your highest performer on Tickets Handled per Month handles 140 tickets. The range for that metric, worst to best, would be from 80 to 140. If an agent is handling 85 tickets per month, they know they are near the low end of the range, whereas an agent handling 130 tickets per month knows that they are near the high end of the range. The same would be true for the other metrics in the scorecard (e.g., CSAT, FCR, etc.).
Using the scorecard, supervisors can coach their agents each month and pinpoint, based on their monthly metric scores, where they should focus their time and attention to improve their performance. A low score on a particular metric shows an area that needs improvement, while a high score on a particular metric highlights an area of strength. In our sample scorecard above, the agent’s metric score for first contact resolution was outstanding at 100%, while their metric score for tickets handled per month was quite low at 0%. The quick diagnosis for this agent’s performance is that they are delivering outstanding quality, but they are doing so at the expense of productivity and need to improve their productivity by handling a larger volume of tickets each month.
Accountability Is Critically Important
Let me also point out that a persistent myth in the industry—that agents don’t want to be measured or held accountable for their performance—is a fallacy. Nothing could be further from the truth. In fact, the best performing service desk agents want transparency, visibility, and accountability because they have nothing to fear, and the agent scorecard gives them the insight they need to improve their performance.
A persistent myth in the industry—that agents don’t want to be measured or held accountable for their performance—is a fallacy.

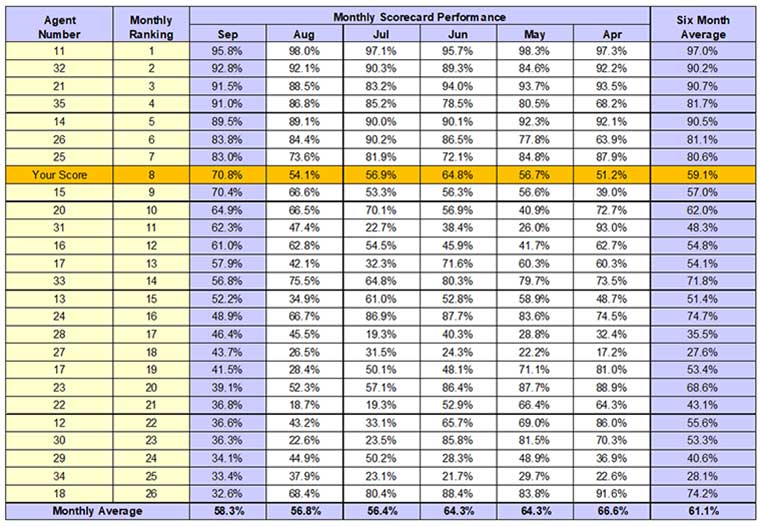
In most cases, service desks that implement the agent balanced scorecard will also post the agent ratings on a monthly basis as illustrated below. The intent here is to help each agent understand how they are performing relative to their peers and to provide an incentive for every agent to improve their performance over time.
Why does all this matter? Because it can be shown empirically that service desks that have implemented agent performance targets, and particularly those who have agent scorecards, enjoy significantly higher performance and job satisfaction scores than service desks that have not implemented agent scorecards. As I mentioned in a past Metric of the Month, agent job satisfaction is a bellwether metric that impacts many other metrics in the service desk. It is positively correlated with customer satisfaction and negatively correlated with agent absenteeism and turnover, meaning that absenteeism and turnover go down as agent job satisfaction goes up.
Finally, the agent scorecard is versatile enough to include any metrics you believe are important to drive the agent behaviors you desire. Our clients who have adopted this tool report almost immediate improvements in individual performance, which of course translates into improvements for the support organization overall!
Please join me for next month’s Metric of the Month: Tickets Prevented, a strategic metric that is a key indicator of proactivity in IT service and support.
Jeff Rumburg is the winner of the 2014 Ron Muns Lifetime Achievement Award, and was named to HDI’s Top 25 Thought Leaders list for 2018. As co-founder and CEO of MetricNet, Jeff has been retained as an IT service and support expert by some of the world’s largest corporations, including American Express, Hewlett Packard, Coca-Cola, and Sony. He was formerly CEO of the Verity Group and Vice President of Gartner. Jeff received his MBA from Harvard University and his MS in Operations Research from Stanford University. Contact Jeff at
[email protected]
. Follow MetricNet on Twitter @MetricNet.