Date Published June 18, 2020 - Last Updated December 10, 2020
The key to an effective and smoothly run business is the efficiency and cohesive integration of its business processes. A business process describes the steps taken to complete any objective, task, or service within a business. Processes can be divided into three distinct categories:
-
Management processes: Business strategy and organizational structure
-
Operational processes: Interaction between business and customer, core business activity
-
Supporting processes: Health and safety, accounting, recruitment
Business processes are born from business process management (BPM) strategy, which is the overall strategy for all organizational operations. BPM is responsible for a business process from its design, through to modeling, to execution, including optimization or re-engineering of existing processes.
The most effective method of creating or analyzing a business process is to visually interpret the steps using a business process diagram, flowchart, or workflow (a.k.a., business process modeling). This will be performed within a company by a team who has detailed knowledge of company process and analysts with expertise in the modeling discipline. The objective is often to increase production or lower costs. By modeling the process, inefficiencies and issues can be identified before committing to a decision or strategy.
There are many ways to visually represent a process. I provide a short, high-level introduction to different process visualization models. I would suggest you look them up, do a bit a research, and determine if they are already in use within your organization. Don’t re-invent the wheel (again). If someone in your organization already uses a process model, go talk to them. Learn what they are doing, which tool they are using, licenses, etc. Which courses would they suggest? What do they like and dislike about the model and the tool they use?
Business Process Model and Notation
BPMN is a common standard for modeling the business processes. It describes the set of intuitively understandable elements and symbols for representing the business processes in the form of diagrams. BPMN is applied and designed for:
- Analyzing and process improvement
- Uncovering and elimination problems
- Solving new challenges and goals in organizational development
- Reducing costs and/or increasing profits
- Enhancing quality and/or performance
Business Process Mapping
Business process mapping refers to the activities involved in defining what exactly a business unit does. It can help answer such questions as:
- Who is responsible for a business unit
- What standard should a business process follow
- How to determine the success of a business process
This method assists (external) organizations requiring support in order to become more effective. A detailed and clear business process diagram allows the outside organizations to determine whether or not the needed improvements can be made to the current process.
Supporting this visual style of quality management, a number of transferable methodologies have been developed.
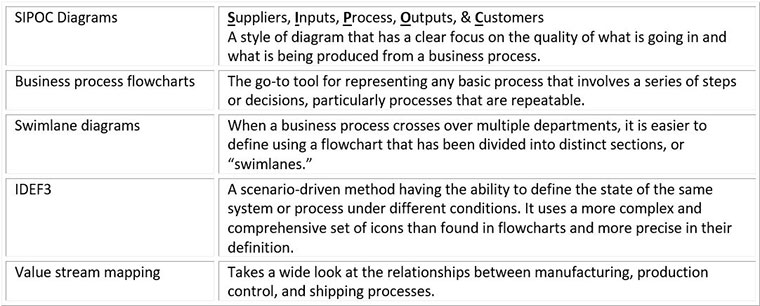
Classic Business Process Modeling
A business process is defined as a logically complete chain of related and repeating sets of activities. The enterprise resources are used for processing « something » to create a « service or product » to deliver value to the customer in the form of an « outcome ». Business process modeling is a well-known quality management tool. It is an effective way to perform the work of an enterprise, its interactions with external organizations, customers and suppliers. It is also a starting point for optimizing and improving the organization’s activities, quality, and performance. The modeling describes the logical relationship of all elements of any business process from its start to completion. This in turn allows giving a cost estimate for each and all business processes of the organization.
Cross-Functional Flowcharts
Cross-functional flowcharts are both powerful and useful for visualizing and analyzing complex business processes that require the involvement of multiple people, teams, or even departments. They visually represent a sequence of the process steps, the order of operations, the relationships between processes, and the responsible functional units (role or department). Using horizontal or vertical swimlanes, these flowcharts visually delimit the process flows going between multiple functional departments and help to group sequentially the process flows to illustrate the interactions between stakeholders, to detect waste, unnecessary delays, and repetitive tasks.
Using this technique enables knowledge workers to depict an organization in its entirety, including all departments and even external influences such as customers or resources. This at-a-glance perspective can be useful for stakeholders and senior managers/executives to clearly define roles and responsibilities.
Event-Driven Process Chain Diagrams
An Event-Driven Process Chain (EPC) Diagram is a type of flowchart widely used for modeling in business engineering and reengineering, business process improvement, analyzing and redesigning business processes, and implementation of enterprise resource planning (ERP). The most well-known modeling methodologies at the moment are ARIS (Architecture of Integrated Information Systems), SADT (Structured Analysis and Design Technique), and UML (Unified Modeling Language). The EPC method was developed within the ARIS framework and is one of the most popular modern methods that make it easy and convenient to simulate business processes.
Process modeling using EPC notation creates a sequence of actions within a single business process that are performed by employees, offices, or departments, and provides a link between organizational and functional models.
IDEF Business Process Diagrams
IDEF is short for “Integration Definition.” It refers to a family of modeling languages that are widely used by both systems and software engineers. It covers a wide range of uses from functional modeling to simulation, object-oriented analysis and design, data, and knowledge acquisition. IDEF has several variations you can apply:
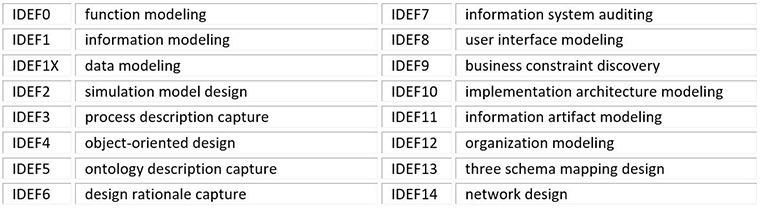
IDEF business process diagrams may be useful for many IT specialists, computer specialists, network and telecommunication engineers, IT managers, software engineers, system administrators, webmasters, system architects, and system engineers, etc.
Logistics Flow Charts
Marketing approaches alone are not enough for business success; highly effective logistics methods for managing stream processes is mandatory. Logistics coordinates all the structures of the enterprise and is immensely important for customers, suppliers, and executives. The goal of logistics is the most rational promotion of goods and services from a supplier to an end-user. It is aimed at optimizing costs, streamlining production processes, marketing, and related services within a single enterprise or group of enterprises, as well as strategic management of financial and information flows. Logistics is a complex process, representing a single chain of inter-related actions—from marketing and receipt of an order to production, storage, and transportation.
Logistics is simultaneously a « philosophy » for a successful business and the « art » of meeting the needs and desires of both consumers and suppliers. The supplier’s goal is to minimize costs and maximize profits, and the client’s goal is to receive a good quality product or service at a reasonable price on time and with top-level service.
Workflow Diagrams
The workflow diagram provides a general overview of a business process, from start to finish, all steps and actions composing it, direction of the workflow, and connections between the steps in the order of their execution. These diagrams visually represent all tasks and actions needed to perform the entirety of the process, clarify the sequence of their execution, as well as identify resources required for the process implementation. They help visualize how tasks will flow between resources, allowing easier process analysis, improvement, and defining potential weaknesses and critical areas. Workflow diagrams have several advantages:
- Defines roles and responsibilities
- Allows for strategy optimization and efficiency by identifying real or potential bottlenecks, redundant steps, or problem departments, mistakes, omissions
- Helps analyze a process as a whole, or on specific components, at each stage of its lifecycle
- Improves communication between team members through visualization
- Facilitates understanding for a multi-national workforce
- Improves performance
- Provides a summation of resources and/or data necessary at each step
Getting Started
The most effective method of creating or analyzing a business process is to visually interpret the steps using a business process diagram, flowchart, or workflow (a.k.a., business process modeling). No matter what process you are analyzing or method you choose, you should always ask three questions to ensure success.
No matter what process you are analyzing or method you choose, you should always ask three questions to ensure success.

1. Where do we want to be (and when)? Which processes need to be mapped out, why, in which order, by when (deadline)?
2. Where are we now? Don’t re-invent the wheel (again). If someone in your organization already uses a process model, go talk to them. Learn what they are doing, which tool they are using, licenses, etc. Which courses would they suggest? What do they like and dislike about the model and the tool they use?
3. How do we get there?
- Create a plan or a list (does not have to be very elaborate)
- Pick a modeling technique from above
- Map out the process using sticky notes with the people living the process
- Validate it with people using the process
- Map out the process in a tool to make it look nice
- Publish it
- Educate new staff on the process(es) when they join the organization or department
- Measure if you have achieved your goal
- Repeat for undocumented processes then fine tune the existing processes as required
Pierre Bernard is currently the Global ITSM Process Manager for IKO Industries. He has 34 years of experience in IT, 7 of those as a service desk manager. Pierre has helped numerous organizations and people learn about and understand the world of IT best practices. He has extensive experience, knowledge, and expertise in service management, organizational change, business management, and continual service improvement. Pierre also holds numerous certifications, including ITIL Expert, AGILE Foundation, PRINCE2 Practitioner, Master Trainer/Facilitator, COBIT5, ISO/IEC 20000, and ISO/IEC 27000. For those people who took an ITIL V2 Foundation (English or French) or Service Manager or an ITIL V3 Continual Service Improvement exam, you’ll be happy to know that Pierre is partly to blame. He was an examiner for those certifications. Connect with him on LinkedIn.