Date Published May 2, 2017 - Last Updated December 6, 2017
Each month, I highlight one Key Performance Indicator (KPI) for service and support. I define the KPI, provide recent benchmarking data for the metric, and discuss key correlations and cause-and-effect relationships for the metric. The purpose of the column is to familiarize you with the KPIs that really matter to your organization and to provide you with actionable insight on how to leverage these KPIs to improve your performance! This month, we tackle service desk cost per ticket.
Cost per unit is a common metric throughout our economy. Many of you know the cost of a gallon of gas, or the cost for a cup of coffee, or the cost of a movie ticket. Yet surprisingly, many service and support managers do not know their own cost per ticket.
Many service and support managers do not know their own cost per ticket.

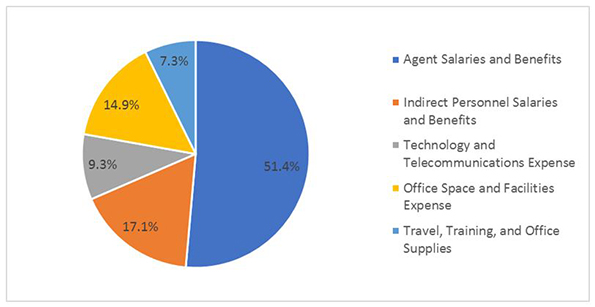
Cost per ticket is the total monthly operating expense of a service desk divided by the monthly ticket volume. Operating expense includes the following components:
- Salaries and benefits for service desk agents
- Salaries and benefits for indirect personnel (team leads, supervisors, workforce schedulers, dispatchers, QA/QC personnel, trainers, and managers)
- Technology and telecom expense (computers, software licensing fees, ACD and VRU costs, telecom headsets and handsets, etc.)
- Facilities expense (office space, utilities, insurance, etc.)
- Travel, training, and office supplies
Service and support is a labor-intensive function. So, as you might expect, the vast majority of costs for a service desk are personnel related. The figure below shows the average cost breakdown for service desks worldwide in 2016. This cost breakdown remains relatively constant from country to country and from region to region.
Why It’s Important
As we learned in last month’s Metric of the Month, cost per ticket and customer satisfaction are often referred to as the foundation metrics in service and support. They are the two most important metrics because ultimately everything boils down to cost containment (as measured by cost per ticket) and quality of service (as measured by Customer Satisfaction).
In any service delivery organization, cost, or more accurately unit cost, is critically important. cost per ticket is a measure of how efficiently a service desk conducts its business. A higher than average cost per ticket is not necessarily a bad thing, particularly if accompanied by higher than average customer satisfaction and service levels. Conversely, a low cost per ticket is not necessarily good, particularly if the low cost is achieved by sacrificing service levels or customer satisfaction. Every service desk should track and trend cost per ticket on a monthly basis.
Key Drivers of Service Desk Cost per Ticket
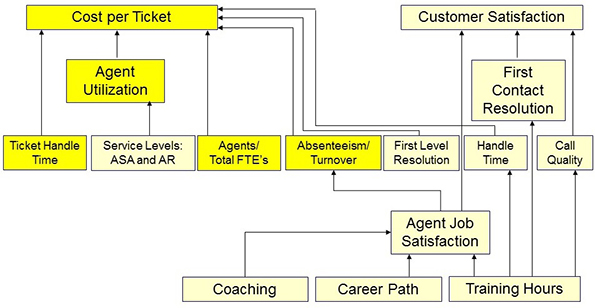
Borrowing the cause-and-effect diagram from last month’s Metric of the Month, we can see that cost per ticket has a number of key drivers. The most important of these drivers are agent utilization and ticket handle time. Secondary drivers include absenteeism, turnover, and the ratio of agents to total service desk headcount. These KPIs are highlighted in the diagram below.
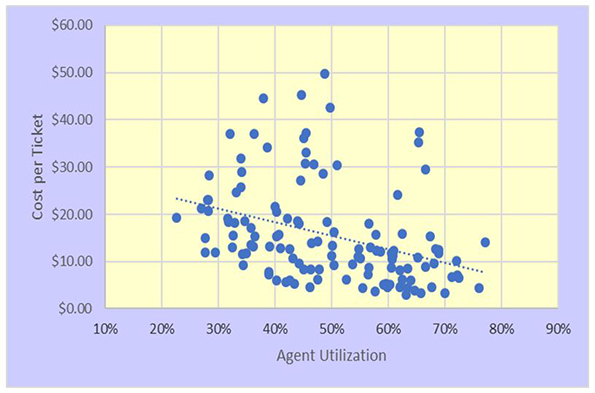
The correlation between ticket handle time and cost per ticket, and between agent utilization and cost per ticket is illustrated in the two charts below that each contain 125 data points.
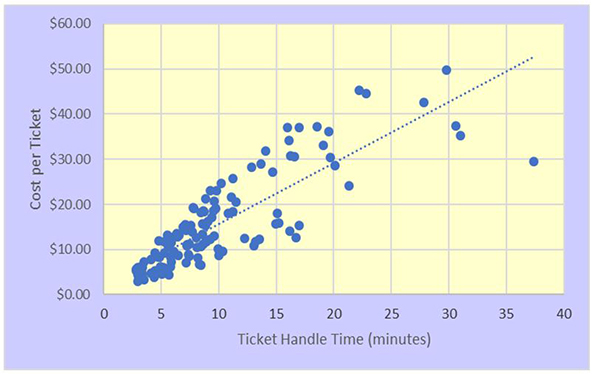
The relationship between ticket handle time and cost per ticket is fairly intuitive. Increasing handle times mean increasing work per ticket, and for a labor-intensive function, that means costs will increase correspondingly. But what accounts for the wide variation around the mean? Why is the cost for a 10-minute ticket $10 for one service desk and $25 for another service desk? The answer is wage rates. Specifically, the wide variation in wage rates within a country. As wage rates vary, so too will cost per ticket. Operating a service desk in a geographic location with lower average wage rates will result in a lower average cost per ticket. Conversely, operating a service desk in a major metropolitan area where wages tend to be much higher will produce a much higher cost per ticket.
The relationship between agent utilization and cost per ticket is also intuitive. Higher utilization means greater productivity and lower costs. The variance around the mean for this chart is even greater than for cost vs. handle time. The reason is that in the utilization chart we have not normalized for handle time. So, it’s possible to have a $10 ticket at 50% utilization as well as a $50 ticket at 50% utilization if the handle time for the $50 ticket is much longer.
What about the secondary drivers of cost: absenteeism, turnover, and the ratio of agents to total headcount? Absenteeism increases costs because a service desk will need to offer overtime hours or retain additional staff in an amount equal to the absentee rate. Let’s say, for example, that a service desk has an average absentee rate of 5%. That means they will be operating at 95% capacity, and will need to add additional headcount or offer overtime hours to make up for the 5% capacity shortfall.
Turnover is costly because, on average, it costs about $12,000 to replace a single service desk FTE in North America. This is the cost of finding a suitable candidate, background checking them, training them, and finally the learning curve costs once the agent starts working on the desk.
Finally, the ratio of agents to total service desk headcount is a measure of managerial efficiency. The average for this metric worldwide is about 78%. What this means is that 78% of service desk personnel are in direct, customer facing service roles. The remaining 22% are supervisors, team leads, trainers, schedulers, QA/QC personnel, etc. If this number is much lower than 78%, it means that the service desk is top heavy; it has too many indirect personnel. If the number is too high, it means that the managerial span of control is not tight enough, and there may be a lack of supervision.
Benchmarking Ranges for Cost per Ticket
The North American averages and ranges for cost per ticket and cost per minute of handle time in 2016 are shown below.
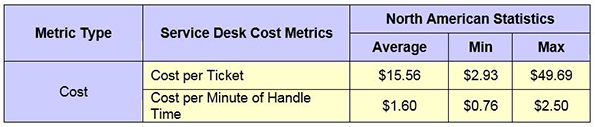
The ranges on cost per ticket (min to max) are enormous, varying by more than an order of magnitude (10X) from min to max. The reasons for this have been explained above and include variations in wage rates, utilization, absenteeism, turnover, and the ratio of agents to total service desk headcount.
Please join us for next month’s Metric of the Month: Customer Satisfaction, the other foundation metric, and the primary measure of effectiveness for the service desk.
Jeff Rumburg is the winner of the 2014 Ron Muns Lifetime Achievement Award, and was named to HDI’s Top 25 Thought Leaders list for 2016. As co-founder and CEO of MetricNet, Jeff has been retained as an IT service and support expert by some of the world’s largest corporations, including American Express, Hewlett Packard, Coca-Cola, and Sony. He was formerly CEO of the Verity Group and Vice President of Gartner. Jeff received his MBA from Harvard University and his MS in Operations Research from Stanford University. Contact Jeff at
[email protected]
. Follow MetricNet on Twitter @MetricNet.