Date Published December 27, 2021 - Last Updated January 20, 2023
Best of HDI in 2021 - #3
Each month, MetricNet highlights one Key Performance Indicator (KPI) for Service and Support. We define the KPI, provide recent benchmarking data for the metric, and discuss key correlations, and cause-and-effect relationships for the metric. The purpose of the column is to familiarize you with the Key Performance Indicators that really matter to your organization, and to provide you with actionable insight on how to leverage these KPIs to improve your performance.
A problem in ITIL is defined as the cause of one or more incidents - there is a cause-and-effect relationship between an incident and a problem. The cause is the problem, and the effect is the incident. If a user reports that they cannot log into an application, this is the incident. When this is reported, the cause of the incident is sometimes not known. If further investigation discovers that the application was inaccessible due to a server overload, that is the problem that caused the incident.
Problem management is one of 34 practices in ITIL 4. It is the practice of identifying and managing (i.e., eliminating) the causes of incidents in an IT service. Problem management sounds great in theory, but in practice it rarely lives up to expectations. The reasons for this include the following:
- Problem management is a labor-intensive process that is very time consuming.
- Those who work on problem management typically have other responsibilities that often take priority over problem management.
- Problem management is almost never measured, so it tends to be managed very poorly.
Although we cannot solve the first two challenges listed above, we can tackle the third issue, and make the case for measuring problem management so that it can be managed more effectively. The most important metrics for problem management include the following:
- The number of known problems
- Problem velocity
- Total number of incidents attached to known problems
- Average number of incidents per known problem
- Tickets per user per month
Each of these metrics is best defined by example. Let’s say that in a typical FORTUNE 500 company we have a problem management database (PMDB) (sometimes also called the known error database) with 2,500 known problems.Let’s further assume that there are 500,000 incidents attached to these known problems. These are raw metrics and come straight from the PMDB.
Based on this raw data, we can calculate the average number of incidents per known problem, which is 500,000 incidents ÷ 2,500 known problems = 200 incidents per problem. Finally, problem velocity can be measured at the problem level or in the aggregate. If we have a problem that has been open for 15 months and has 2,000 incidents attached to it, the problem velocity is 2,000 incidents ÷ 15 months = 133 incidents per month. In other words, the problem is growing at an average rate of 133 new incidents per month.
Now, let’s assume that in the entire PMDB the average problem is 20 months old. We can calculate the average problem velocity for all problems as follows: 200 average incidents per problem ÷ 20 months = 10 incidents per month. That is the growth rate, or velocity, of the average problem in the PMDB.
Most enterprises have thousands of known problems, and many of these problems have multiple root causes. It is somewhat unusual to eliminate a problem in its entirety. Instead, most ITSM organizations manage their known problems by keeping the problem velocity as low as possible. In a typical case, the focus would be on the top 100 or so problems with the highest problem velocity. The diagram below shows an example of the top 20 problems in an organization ranked by problem velocity.
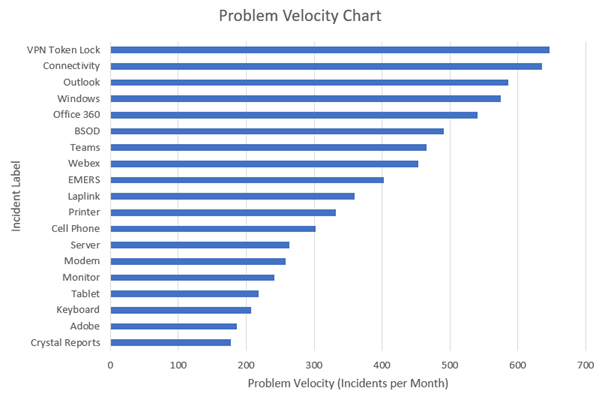
After several days, weeks, or months of effort, the problem velocity profile will look very different. Ideally the velocity of the top problems will have been reduced dramatically, replaced by problems that have risen to the top of the list yet have a lower velocity than the problems they replaced. By systematically focusing on the highest velocity problems, the average problem velocity will be reduced, and the average number of incidents per problem will also decrease.
The ultimate measure of success for problem management is when the tickets per user per month decreases consistently every month. This is a good outcome for both users and IT support. It means that the workload, and hence the cost of support, is lower, and users are more productive because they have fewer incidents.
For more background on tickets per user per month please refer to this Metric of the Month. And for more background on tickets prevented please refer to this Metric of the Month.
Please join us for next month’s Metric of the Month: The ROI of Artificial Intelligence, an important metric when making the business case for investing in AI, and for measuring the cost effectiveness of your existing AI tools.
Jeff Rumburg is the Managing Partner and co-founder of MetricNet, LLC. MetricNet is the leading source of benchmarks and metrics for IT service and support professionals worldwide. For more information, please go to www.metricnet.com.