Date Published December 15, 2016 - Last Updated December 15, 2016
The goal of operations is to run efficiently, provide consistent, high-quality services, and continually improve the customer experience. Reports should show that we are succeeding or identify areas for improvement. Although we have plenty of data to use for trending, improving services, and promoting value, many IT organizations struggle to deliver the right mix of metrics and give the right reports to the right audience.
Too often, reports are made up of the easy-to-collect metrics or show a single metric instead of telling a story and providing useful information that drives action or shows business value. For example, a weekly abandoned rate report for the service desk cannot stand alone. Additional information is needed to assess whether they are doing well or whether action needs to be taken. What is the target they are trying to achieve? Was the volume lower than normal or did they resolve calls more quickly? Have they increased first contact resolution?
For information on designing dashboards to share business-critical information, check out Mike Hanson’s By the Dashboard Light.
Another example could be an availability report for a service. Just showing whether it was available or not doesn’t provide enough information. When should the service be available? If it wasn’t, was it due to routine maintenance or an outage? These reports are usually written from an IT perspective and show how efficiently we are operating. However, they don’t connect the dots to the value we are providing to the business.
To use the examples above, terms like availability and abandoned rate are IT terms, and the value isn’t recognized without adding information to tell the whole story. Additionally, it is important to include what matters to the business. As a general rule, IT should be able to:
- Site specific business tasks that IT services have facilitated or improved
- Quantify the amount of time IT has helped the business save
- Measure productivity gains facilitated by IT
- Show cost savings or an increase in profits or customer retention (at the organizational level)
- Demonstrate that IT is working efficiently and cost-effectively
If your reports are not currently providing this type of information, you may need to reverse your approach to developing reports. Too often, we start with the data and canned reports that our tools provide to develop reports. This usually results in reports that have limited value. Reversing your approach starts with the questions (before considering the data):
- What do your stakeholders want to know?
- What critical services do you provide, and how does it impact business?
- What does IT need to know in order to improve services and run efficiently and effectively?
- What trends are we seeing that we should explore further?
- What results have we seen from recent improvements (and their impact on the business)?
Keep in mind that any questions regarding business goals, needs, or questions should come from the business, not IT. In other words, ask; don’t assume. IT should not define business (value) reports without consulting business partners! Most likely, your business partners already have questions they’d like to have answered or information that they need to have to help them run or improve business processes in their respective areas.
Here are some examples of questions your business partners and IT executives may be asking:
| Senior Managers | Business Unit Managers | IT Executives |
|---|
• Does IT support the achievement of business objectives? |
• Are IT services delivered at a competitive cost? |
• Are we growing professional competencies needed for successful service delivery? |
| • What value does the expenditure on IT deliver? |
• Does IT deliver on its service level commitments? |
• Are we successfully improving business productivity? |
| • Are IT costs being managed effectively? |
• Do IT investments positively impact business productivity or the customer experience? |
• Is training before a rollout necessary? If yes, is it successful? |
| • Are risks being identified and managed? |
• Does IT contribute to the achievement of our business strategies? |
• Do we effectively measure and reward individual and team performance? |
| • Are targeted inter-company IT strategies being achieved? |
• How are IT services impacting my department or business processes? |
• Do we capture organizational knowledge to continuously improve performance? |
|
• Is IT helping my team to be more productive? |
• Can we attract and retain the talent needed to support the business? |
By starting with questions (and getting them from your business and IT partners), you can deliver the right information to the right people. This will ensure that operational (efficiency and quality) reports–those that show how efficiently and effectively IT is running–are not given to the business (unless requested) but used internally to improve IT operations. Efficiency metrics and reports are those that show that we are staffed appropriately and that we are handling the volume well or are meeting service levels.
Based on the business partners’ questions, IT can provide useful business (effectiveness or value) reports–those that are tied to business processes, goals, and impact–that allow the business to make better decisions and recognize the value of IT services. Below is a sampling of different types of efficiency, quality, and value reports.
| Efficiency | Quality | Value |
|---|
| • Network speed |
• Baseline |
• Customer Satisfaction |
• First contact resolution (FCR)
|
• System performance monitoring |
• Saved time |
| • IT hours spent on projects |
• Incident monitoring |
• Productivity |
• Time to resolution
|
• Knowledge monitoring |
• Business impact |
| • Accuracy |
• Quality Index |
• Correlation to business needs |
| • On time, on budget |
• Core system availability |
• WIIFM (What’s in it for me?) |
| • Transactions per second |
• Coaching |
• Accuracy |
| • Defect removal |
• Alignment with goals |
• Trending (Top types and Priority |
• Correct routing
|
• Proper sense of urgency |
• Cost per contact to business |
• Automation
|
• Customer service skills |
|
• Appropriate prioritization
|
• SLA/OLA compliance |
|
• Maximum duration of outage
|
• Service review meetings and improvement plans |
|
| • Number of core system outages |
|
|
| • Reliability |
|
|
| • Mean time to repair |
|
|
Once you collect the questions, you can begin looking at your current metrics and reports. Determine whether you already have reports that answer the questions. Often, you have the data, but haven’t combined different metrics to tell the story. For example, let’s consider an IT group that supports a doctor’s office. The office administrators are complaining that patient wait times are too long after lunch and want to know why.
Looking for more great content like this? Look no further than the HDI 2017 Conference & Expo!
Learn more about HDI 2017
IT operations could generate a report showing physician availability between 12 p.m. and 3 p.m., but that alone doesn’t answer the question. Instead, IT should generate a report (or multiple reports) from different data sources:
- Combined physician and staff availability data from the staffing application
- Average number of patient check-ins for that location between 12 p.m. and 3 p.m. from the patient registration system
- Average time per patient seen from the electronic medical record
The report would correlate these data points to calculate average turnaround time, which should provide insight into the cause of the bottleneck and allow the business to develop potential solutions. IT can take this a step further to help to identify bottlenecks by providing report break downs by the type of wait time:
- Arrival time to patient seen by nurse
- Patient seen by nurse to patient seen by MD
- Patient seen by MD to check out item
IT could then overlay the patient experience reports with network status during those same timeframes (and across different locations) to begin to assess the root cause and analyze further. This combination of reports allows the business/organization to assess current business processes and IT can assess the IT services themselves, then work together to improve the service, performance, or business process.
Another possibility is that you have trending reports that answer the question at a high level, and need to take a deeper dive into metrics to provide more specific answers. Let’s consider the service availability report. We’re noticing a trend of processing slowing down Monday through Friday from 5 a.m. EST to 10 p.m. EST at the end of every month. This trend shows that we need to see what’s happening between those hours that is impacting processing time. Why between those hours? Why the last week of every month? Is it all locations or only some locations? Is there an end-of-month business process that all locations in all time zones carry out during that last week?
If you don’t currently have reports that answer the questions, determine what data would be needed to tell the story or provide the answers. Additionally, determine which metrics and reports measure efficiency, identify improvements, or show results. To demonstrate the approach, let’s take one of the questions from the business unit managers list and walk through the necessary steps:
Is IT helping my team to be more productive?
There are two ways to measure this. One would require a baseline of how the team works prior to any changes to the IT services. How many clicks are needed to tackle various business processes (this would require observation and usability testing to establish the baseline)? How much time does it take to complete business tasks?
Document the baseline and run the same tests after you’ve implemented a change and show the difference. For example, consider an IT department that supports POS systems in a fast-food restaurant chain. After visiting a location, IT learned that once the people taking the orders ring them into the register, they have to click on a button to “post” the order on a screen in the kitchen for the cooks. This takes an extra three seconds to click on post and another three seconds before returning to the screen to enter a new order (IF people always remember to click “post” right away). Six extra seconds may not seem like a lot. However, if we multiply six seconds by every order on every register, there is a lot of wasted time.
Let’s do the math:
- The restaurant is open 18 hours/day
- They process 40 orders/hour * 5 registers *18 hours = 3600 orders/day
- 6 seconds wasted/order * 3600 orders/day = 21,600 seconds (360 minutes or 6 hours) wasted/day item
IT makes a change so that the order automatically posts and the screen refreshes automatically. This automation saves four seconds per order, which gives the restaurant back four hours of processing (or taking more orders) per day . A report showing before and after processing time would definitely quantify the value of IT service improvements!
Another option is to identify all IT services that impact business processes in that department and everyone who works on that team. Assuming that your categorization allows you to trend on those services or people, you can run a high-level trending report to see the number of tickets received from that business unit that are related to those services. Looking at the volume across the past three to six months, you should see some trends that will allow you to assess productivity impacts.
Here is another example. Your trending showed that the employees were frequently reaching out to the service desk with how-to questions on Outlook. After seeing this trend, IT provided training and added knowledge articles and how-to videos in a self-help portal (for the most frequently asked Outlook questions). This report shows the success of that effort and quantifies the improvement:
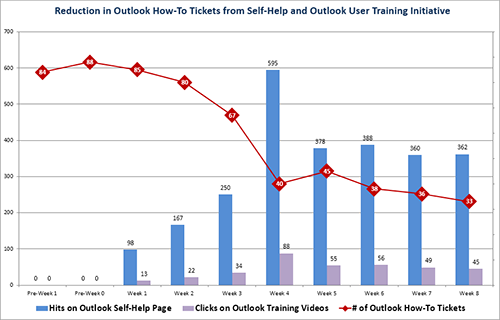
You can see a significant reduction in the number of tickets being opened. IT can continue trending and providing additional improvements.
Let’s look at an IT example of an IT executive question:
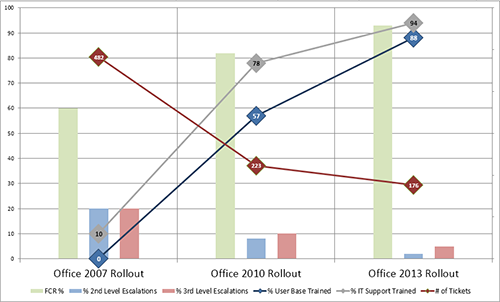
Is training before a rollout necessary? If yes, is it successful?
Trending showed a high volume of calls to the service desk after the last rollouts (trended across three rollouts that had similar average numbers of calls—which answers the first question—yes, it is necessary). Many calls were escalated to resolver teams (which increases the cost per contact and negatively impacts productivity for escalation tiers).
For the next rollout, the project included training for IT and for end-users. The trend shows that the training was successful. The service desk saw fewer calls overall and had higher first contact resolution, which equates to fewer escalations.
Although these examples are situational, the same approach works for any type of questions you are trying to answer. Once you know what the business or IT partner wants to know, look at your current reports and metrics to see if they answer the question. Keep in mind that some answers or stories may require collecting data from different tools or modules and combining them into one report.
When IT connects the dots between IT services and business success, IT gains credibility.

Over time, you may find that customizing reports to answer specific questions results in fewer overall reports. The reports can also help IT to be more proactive, which also provides value to the business!
Developing the right reports goes beyond completing a task for your performance objectives. Reading the trends, making improvements, and becoming more efficient helps IT to be less reactive and positions it to make a real difference for the business. Regardless of the industry or business drivers (reputation, cost reduction, profit, etc.), when IT connects the dots between IT services and business success, IT gains credibility and becomes a valued business partner and strategic asset.
Tips to Keep in Mind
- The incident management module of your service management tool provides invaluable information for all areas of IT; it’s not just about support!
- You can make reports say anything you want, but contradictions will surface and reality will be uncovered! Make sure the data is accurate and double-check the results by running different reports and looking at situations from many angles (e.g., customer satisfaction, quality, etc.).
- Value is defined and measured by the business, not IT.
- Trending reports are a necessity. Once you recognize trends, take deeper dives into data to develop specific reports that clarify the trends or identify necessary action.
- Reports should be intuitive. If you have to explain your report to someone, you are not getting the message across. Either the structure doesn’t work, the terminology isn’t understood, or the report is not using the right data. For example, a report entitled, Severity 1 Incident Report is not going to have great significance to the business unless we explain it. However, if the report title is Revenue Impacting Incidents, the importance is clear to the business without explanation!
- If your management or business partners are only asking for a few specific reports, deliver them; don’t feel compelled to deliver more than what they ask for.
- Being transparent and showing improvements helps to build better relationships with the business.
- Once partnerships are established with the business, you should gain support from business partners to ensure that employees are using self-help tools, following IT processes, and adhering to policies.
- Even if you don’t agree, customer perception is reality! Use reports to provide factual information that drives the right actions and results.
Rae Ann Bruno is the President of Business Solutions Training, an organization focused on training and consulting in various areas of ITIL, Knowledge-Centered Support (KCS), service desk improvement, internal marketing, metrics, and ITIL process improvement. Rae Ann holds several ITIL and HDI certifications and is a faculty trainer for HDI ITIL and Support Center certification courses. She is a member of the HDI International Standards committee and a frequent speaker at leadership and support conferences. Follow Rae Ann on Twitter @raeannbruno and connect with her on LinkedIn.