Date Published October 18, 2017 - Last Updated December 6, 2017
Each month, I highlight one Key Performance Indicator (KPI) for service and support. I define the KPI, provide recent benchmarking data for the metric, and discuss key correlations and cause-and-effect relationships for the metric. The purpose of the column is to familiarize you with the KPIs that really matter to your organization and to provide you with actionable insight on how to leverage these KPIs to improve your performance! This month, I look at desktop support cost per ticket.
Cost per ticket is the total monthly operating expense of desktop support divided by the monthly ticket volume. Operating expense includes the following components:
- Salaries and benefits for desktop support technicians
- Salaries and benefits for indirect personnel (team leads, supervisors, workforce schedulers, dispatchers, QA/QC personnel, trainers, and managers)
- Technology and telecom expense (computers, software licensing fees, etc.)
- Facilities expense (office space, utilities, insurance, etc.)
- Travel, training, and office supplies
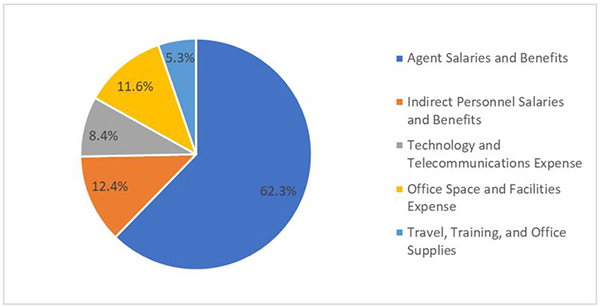
As you might expect, the majority of costs for desktop support are personnel related. The figure below shows the average breakdown of costs for North American desktop support organizations in 2017.
Why It’s Important
Cost per ticket, along with customer satisfaction, are often referred to as the foundation metrics in desktop support. They are the two most important metrics because ultimately everything boils down to cost containment (as measured by cost per ticket) and quality of service (as measured by customer satisfaction).
In any service delivery organization, cost, or more accurately unit cost, is critically important. Cost per ticket is a measure of how efficiently desktop support conducts its business. A higher than average cost per ticket is not necessarily a bad thing, particularly if accompanied by higher than average quality levels and lower mean times to resolve. Conversely, a low cost per ticket is not necessarily good, particularly if the low cost is achieved by sacrificing quality of service or results in longer than average resolution times. Every desktop support organization should track and trend cost per ticket on a monthly basis.
A higher than average cost per ticket is not necessarily a bad thing.

Deconstructing Cost per Ticket
Desktop support tickets are comprised of incidents and service requests, as shown in the figure below. Just as cost per ticket gives us the unit cost for the level 1 service desk, cost per ticket, cost per incident, and cost per service request give us the unit costs for desktop support.
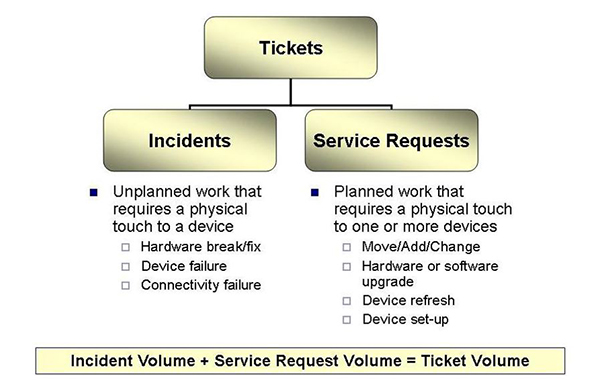
In general, incidents require less time to resolve than service requests, so the cost per incident is almost always less than the cost per service request. Since the cost per ticket is a weighted average of the cost per incident and the cost per service request, the mix of incidents and service requests will strongly influence the cost per ticket.
Let’s assume, for example, that at Company ABC the cost per incident is $50, while the cost per service request is $100. Additionally, 75% of ABC’s tickets are incidents, while the remaining 25% of tickets are service requests. The cost per ticket can be calculated based upon a weighted average as follows:
cost per ticket = ($50 X 75%) + ($100 X 25%) = $62.50
Now take the example of Company XYZ who has the same cost per incident and cost per service request as Company ABC, but whose mix of incidents and service requests is very different. Specifically, at XYZ only 40% of tickets are incidents while the remaining 60% of tickets are service requests. The weighted average cost per ticket for XYZ can be calculated as follows:
cost per ticket = ($50 X 40%) + ($100 X 60%) = $80.00
So although ABC and XYZ have the exact same cost per incident and cost per service request, their unique mix of incidents and service requests yields a very different cost per ticket. If both organizations were to handle 2,000 tickets per month, Company XYZ would spend $35,000 more per month on desktop support than Company ABC, simply because a larger percentage of their tickets are service requests!
Another key factor that influences the cost per ticket is the user population density. Desktop support technicians working in a high-density user environment (e.g., a high-rise office building with lots of cubicles) are able to handle a larger volume of tickets per month than a technician supporting a work environment spread across a vast geographical area (think desktop support for a retail bank with hundreds of branches across the country).
Benchmarking Ranges for Cost per Ticket
The North American averages and ranges for cost per ticket, cost per incident, and cost per service request in 2017 are shown in the figure below.
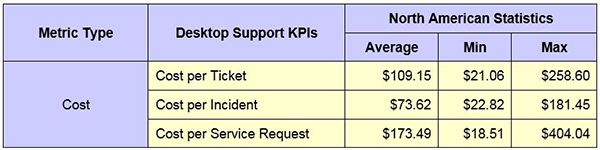
The ranges on these metrics (min to max) are enormous, varying by more than an order of magnitude (10X) from min to max. The reasons for this were outlined above and include the user population density and the unique mix of incidents and service requests.
You may recall a few months back that we discussed cost per ticket for the level 1 service desk. The North American average service desk cost per ticket was $15.56. Why is the cost per ticket so much higher for desktop support than it is for the level 1 service desk?
First, desktop support technicians typically earn more than level 1 agents. Secondly, the work time per ticket in desktop support (equivalent to the average handle time for the service desk) is generally higher for desktop tickets than it is for service desk tickets because the tickets handled by desktop support tend to be more complex. Finally, true desktop support is performed device-side or deskside, which means that the technician will travel to the site of the ticket. These travel times can range from a low of five minutes each way in a high-density environment to an hour or more each way in a low-density environment such as a large military base. Travel time therefore adds significantly to the cost of a desktop ticket.
Please join me for next month’s Metric of the Month: Level 1 Resolution Rate, a service desk metric (sometimes confused with first contact resolution rate) that provides important insights into Total Cost of Ownership (TCO) for end-user support.
Jeff Rumburg is the winner of the 2014 Ron Muns Lifetime Achievement Award, and was named to HDI’s Top 25 Thought Leaders list for 2016. As co-founder and CEO of MetricNet, Jeff has been retained as an IT service and support expert by some of the world’s largest corporations, including American Express, Hewlett Packard, Coca-Cola, and Sony. He was formerly CEO of the Verity Group and Vice President of Gartner. Jeff received his MBA from Harvard University and his MS in Operations Research from Stanford University. Contact Jeff at
[email protected]
. Follow MetricNet on Twitter @MetricNet.