Date Published August 15, 2017 - Last Updated December 6, 2017
Hello everyone! I’m thrilled to be back and once again writing a regular column on metrics for HDI!
Each month, I will highlight one Key Performance Indicator (KPI) for service and support. We will define the KPI, provide recent benchmarking data for the metric, and discuss key correlations and cause/effect relationships for the metric. The purpose of the column is to familiarize you with the KPIs that really matter to your organization and to provide you with actionable insight on how to leverage these KPIs to improve your performance!
This month, I will depart from our traditional format, and instead of discussing a single metric, I will explore the cause-and-effect relationships for service desk KPIs. This will give us an overarching framework and roadmap for discussing future KPIs in this column.
Cause-and-Effect for Service Desk KPIs
Many of us have heard the sage advice “You can’t manage what you don’t measure.” This is particularly true for the service desk, where effective performance measurement is not just a necessity, but a prerequisite for effective decision-making. Despite the widespread belief in this statement, few service desks use KPIs to their full potential. In fact, the vast majority of service desks use metrics to track and trend their performance—but nothing more! Unfortunately, in this mode a service desk misses the real value of performance measurement by failing to exploit the diagnostic capabilities of KPIs. But the true potential of KPIs can only be unlocked when they are used holistically, not just to measure performance, but also to diagnose and understand the underlying drivers of performance.
Few service desks use KPIs to their full potential.

The key to using KPIs diagnostically is to understand their cause-and-effect relationships. You can think of these relationships as a linkage where all the KPIs are interconnected. When one KPI moves up or down, other KPIs invariably move with it. Understanding this linkage is enormously powerful because it provides insight into the levers you can pull to achieve desired outcomes.
The service desk cause-and-effect diagram below represents the service desk KPI linkage and will be central to our discussion today.
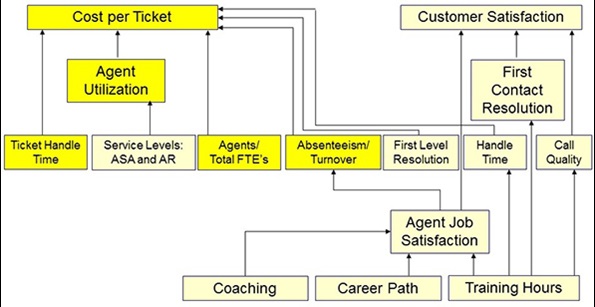
The Foundation Metrics
Virtually everything a service desk does can be viewed through the lens of cost and quality. Will this new technology reduce my costs? Will this new process improve customer satisfaction? This insight is crucial because it greatly simplifies decision-making on the service desk. Any undertaking that does not have the long-term effect of improving customer satisfaction, reducing costs, or both, is simply not worth doing. This is why cost per ticket and customer satisfaction are known as the foundation metrics.
These metrics are also very useful for telling the story of service desk performance. Most people instinctively understand cost and customer satisfaction, so it is easy to have a discussion about service desk performance in the context of these metrics. It is important to note, however, that the foundation metrics cannot be directly controlled. Instead, they are controlled through their underlying drivers.
The Underlying Drivers
Every KPI in the service desk is either directly or indirectly connected to cost per ticket and customer satisfaction. Those that directly impact the foundation metrics are called the underlying drivers, and include agent utilization, first contact resolution rate, and agent job satisfaction. Improvements in any of these metrics result in corresponding improvements in the foundation metrics. But unlike the foundation metrics, which cannot be directly controlled, the underlying drivers can be directly controlled. In fact, this is where you have the greatest leverage to impact the cost and quality of your service desk!
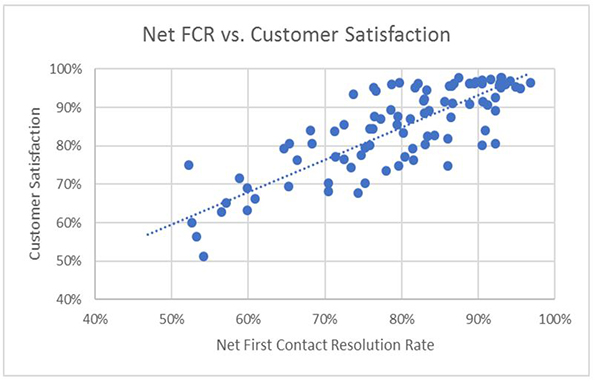
If a service desk is struggling with high costs, for example, reducing the cost per ticket can be achieved by increasing agent utilization or by reducing agent absenteeism and turnover. Likewise, if the goal of the service desk is to improve customer satisfaction, this can be achieved by improving first contact resolution rate, call quality, or agent job satisfaction. The cause-and-effect relationship between first contact resolution rate and customer satisfaction is shown in the chart and table below that use MetricNet benchmarking data from 2016.
The Bellwether Metrics
Agent satisfaction and agent training hours are considered bellwether metrics because they are at the base of the KPI cause-and-effect diagram and impact virtually every other metric in the service desk. Any movement in the bellwether metrics will be felt throughout the KPI linkage and will eventually have an impact on the foundation metrics. If I know the agent job satisfaction and training hours for a service desk, I can almost always predict what the cost and customer satisfaction will be.
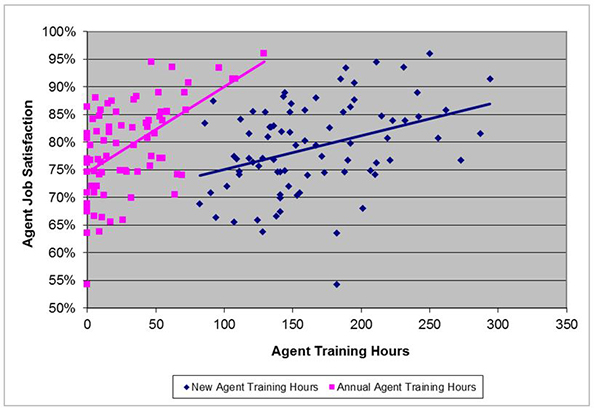
High levels of agent job satisfaction translate into lower absenteeism and turnover, which then translates into lower cost. Likewise training hours that are above average almost always have the effect of producing higher first contact resolution rates and call quality, which then drives higher customer satisfaction levels. Moreover, training hours are also one of the key drivers of agent job satisfaction and therefore represent a high leverage opportunity for a service desk to improve both its cost and quality performance. Once again, using MetricNet benchmarking data from 2016, the chart and table below show the impact of training hours on agent job satisfaction.
Once you become familiar with the cause-and-effect relationships of service desk KPIs you will be in a much better position to identify, diagnose, and act upon any performance gaps in your service desk. This includes positive performance gaps, which you want to perpetuate, as well as negative performance gaps, which you can mitigate or eliminate by impacting the underling drivers.
Please join me for next month’s Metric of the Month: Cost per Ticket, one of the foundation metrics and the primary measure of efficiency for the service desk.
Jeff is presenting two sessions on metrics at HDI 2017 Conference & Expo.
Jeff Rumburg is the winner of the 2014 Ron Muns Lifetime Achievement Award, and was named to HDI’s Top 25 Thought Leaders list for 2016. As co- founder and CEO of MetricNet, Jeff has been retained as an IT service and support expert by some of the world’s largest corporations, including American Express, Hewlett Packard, Coca- Cola, and Sony. He was formerly CEO of the Verity Group and Vice President of Gartner. Jeff received his MBA from Harvard University and his MS in Operations Research from Stanford University. Contact Jeff at
[email protected]
. Follow MetricNet on Twitter @MetricNet.