Date Published August 15, 2017 - Last Updated December 6, 2017
Most service and support organizations make improvements only incrementally, through trial-and-error. As a result, fewer than 10% ever achieve world-class performance. We define a world-class support organization as one that meets the following performance criteria:
- Cost per ticket is in the lowest quartile when compared to an external peer group
- Customer satisfaction is in the top quartile when compared to an external peer group
- They operate within an ITIL framework
- They achieve a demonstrable ROI of greater than 100%
What world-class performers have in common is that almost all of them benchmark their performance at least once a year. So rather than improving incrementally, at an evolutionary pace, these top performers leverage benchmarking to build upon the industry’s proven best practices. This allows them to bypass the incrementalism associated with trial-and-error improvement, thereby achieving world-class performance at a revolutionary pace!
The 80/20 Rule for Service and Support KPIs
When it comes to KPIs for service and support, less really is more! Although there are literally hundreds of service and support metrics, the short list of metrics that really matter for a level 1 service desk includes the following:
- Cost per Ticket
- Customer Satisfaction
- Agent Utilization
- First Contact Resolution Rate
- First Level Resolution Rate
- Agent Job Satisfaction
These metrics represent the 80/20 rule for service desk KPIs: 80% of the value you receive from performance measurement and management in your service desk can be derived from these six simple metrics! With these metrics, one can measure and manage a service desk very effectively. The same principle applies to desktop support, where the short list of metrics that really matter includes those listed above for the service desk, but we add one additional metric called Mean Time to Resolve (MTTR), which measures the elapsed time from when a ticket is opened until it is closed.
When it comes to KPIs for service and support, less really is more!

Almost all support organizations track some KPIs. Likewise, almost all support organizations do some reporting. But very few go beyond this “observational mode” with their KPI’s and actively leverage their metrics for continuous improvement. Yet the true value of KPIs can only be unlocked when they are used not just to track and trend performance, but also to diagnose strengths and weaknesses and then act upon those insights to close or mitigate any performance gaps.
In my experience, there are two primary barriers that prevent support organizations from moving beyond metrics as a mere visual tool to leveraging metrics for world-class performance. The first barrier is that most do not understand the cause-and-effect relationships of the KPIs. The second barrier is that most do not know how to establish performance targets because they don’t have any idea what constitutes poor, acceptable, above average, or outstanding performance. But there is a straightforward solution to both dilemmas.
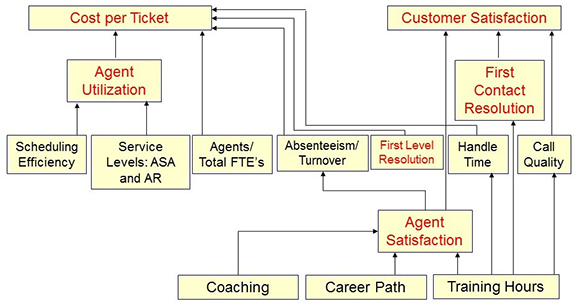
The KPIs for service and support are interconnected through a linkage that is illustrated in the cause-and-effect diagram below. The metrics in red are the ones on our short list of metrics that really matter. This linkage demonstrates that any time one metric moves, they all move! This is a critical concept to understand, as it empowers you to affect positive change in your support organization. Increasing agent utilization, for example, will reduce your cost per ticket. Likewise, increasing first contact resolution rate will increase customer satisfaction. And if you are trying to improve agent job satisfaction (and hence morale), you can achieve that objective through training, coaching, and career pathing.
The Transformative Power of Benchmarking
What about establishing performance goals and then achieving those goals? The empirical evidence suggests that benchmarking is the single most effective tool for realizing the benefits of continuous service improvement and ultimately achieving world-class performance. In fact, there is a virtual one-to-one correspondence between support organizations that are world-class and support organizations that benchmark their performance annually.
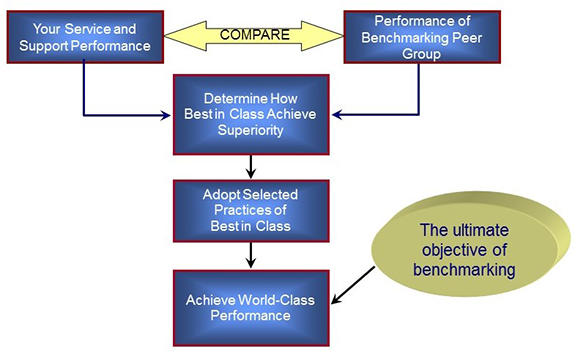
Benchmarking is a well-established tool for measuring and managing your performance. Effective benchmarking enables an organization to quantify its performance, compare itself to others in the industry, identify performance gaps, and define the actions necessary to close the gaps. Although benchmarking is a rigorous analytical process, conducting a benchmark is relatively straightforward. The basic approach is illustrated below.
Let me demonstrate with a brief case study how benchmarking empowers organizations to achieve transformational improvement. The table below shows actual data from a benchmark that included a total of 42 service desks. As you can see, the cost per ticket is well above average, and customer satisfaction is well below average (both metrics are highlighted in the table). It is worth pointing out that before conducting this benchmark, the service desk in our case study had no idea that their performance was poor. In fact, they thought they were doing quite well because both metrics–cost per ticket and customer satisfaction–were trending in the right direction. But a positive trend, by itself, does not necessarily mean that you are performing well. It is only by benchmarking against a valid, external peer group that you can objectively and definitively judge your performance.
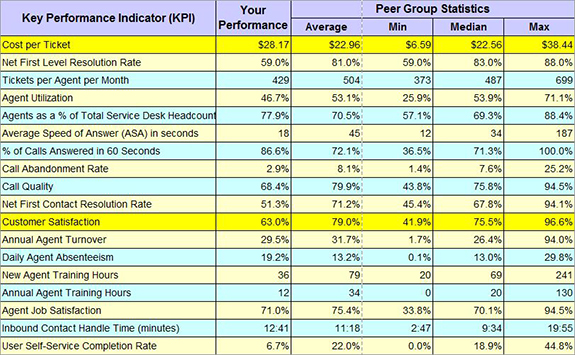
We know from our KPI cause-and-effect diagram that agent utilization is a primary driver of cost per ticket. Additionally, we know that service levels have a significant impact on agent utilization. The data from our case study shows that utilization is below the peer group average (hence the high cost), and that service levels are extremely aggressive (hence the low utilization). This simple diagnosis, enabled by our understanding of how the KPIs are interconnected and the external data from the benchmark, tells us everything we need to know about how to close the cost gap for this service desk.
This organization is quite simply overstaffed. That’s why their utilization is low and their costs are high. Moreover, they are overstaffed because they are pursuing very aggressive service level targets. The remedy is quite simple: reduce headcount through attrition until agent utilization reaches the benchmarking peer group average. While this will reduce costs, it will also cause the service levels–ASA and abandonment rate–to increase. But that’s an acceptable tradeoff because service levels have very little impact on customer satisfaction in a service desk. The service desk in question implemented these measures, and within six months their cost per ticket was well below the peer group average.
What about their low customer satisfaction? Following the same logic we used to diagnose their high costs, we see that first contact resolution rate (FCR), a primary driver of customer satisfaction, is low. We also see that training hours, a key driver of FCR, are also low. Here again, the remedy is straightforward. Increasing training hours will have the effect of improving FCR, and that, in turn, will have the effect of improving customer satisfaction. The service desk in our case study implemented the change by increasing new and annual training hours, and in short order their FCR and customer satisfaction had surpassed the peer group average.
Now, let’s create some performance goals. Recall that our definition of world-class performance states that you must be in the top quartile on customer satisfaction and in the bottom quartile on cost per ticket. Although the quartiles are not shown in the data table above, we know from the benchmark that the top quartile for customer satisfaction ranges from 89.1% to 96.6%, and the bottom quartile for cost per ticket ranges from $6.59 to $16.11. Assuming that the goal is world-class performance, one could reasonably set a goal of $16.11 for cost per ticket, and a goal of 89.1% for customer satisfaction.
Conclusions
The power of benchmarking combined with an understanding of the cause-and-effect relationship of service and support KPIs cannot be overstated. Together they allow you to:
- Measure your performance using the KPIs that matter most
- Compare your performance to an external peer group
- Identify strengths and weaknesses in your support organization
- Establish achievable performance goals
- Take actions to improve your performance and reach your goals
- Achieve world-class performance in the shortest possible timeframe
Finally, if you have never benchmarked your service desk or desktop support functions before, you should not be intimidated by the process. As mentioned previously, the benchmarking methodology is very straightforward. Moreover, an effective benchmark does not have to cost a lot of time or money. In fact, benchmarking has the highest ROI of any tool in the continuous improvement toolbox!
Jeff Rumburg is the winner of the 2014 Ron Muns Lifetime Achievement Award, and was named to HDI’s Top 25 Thought Leaders list for 2016. As co-founder and CEO of MetricNet, Jeff has been retained as an IT service and support expert by some of the world’s largest corporations, including American Express, Hewlett Packard, Coca-Cola, and Sony. He was formerly CEO of the Verity Group and Vice President of Gartner. Jeff received his MBA from Harvard University and his MS in Operations Research from Stanford University. Contact Jeff at
[email protected]
. Follow MetricNet on Twitter @MetricNet.