Date Published February 20, 2019 - Last Updated December 17, 2019
Each month, I highlight one Key Performance Indicator (KPI) for service and support. I define the KPI, provide recent benchmarking data for the metric, and discuss key correlations and cause-and-effect relationships for the metric. The purpose of the column is to familiarize you with the KPIs that really matter to your organization and to provide you with actionable insight on how to leverage these KPIs to improve your performance! This month, I look at agent to supervisor ratio.
The agent to supervisor ratio is simply the number of front-line agents divided by the number of supervisors for a service desk. It is a measure of management span of control and managerial efficiency. The comparable metric for desktop support is the number of technicians divided by the number of supervisors in desktop support. In this article, I will use service desk examples and benchmarking data, but the principles discussed apply equally to the ratio of technicians to supervisors in desktop support.
Join Jeff for a metrics deep dive pre-conference workshop at HDI 2019
Join us!
Why It’s Important
Service desk managers and supervisors frequently ask me about the proper ratio of agents to supervisors. Should it be 5 to 1? 10 to 1? 20 to 1? Like most KPIs, there are tradeoffs involved with this metric. If the ratio is too high, the management span of control is too broad, and agents can be working without the proper level of oversight and supervision. This, in turn, can lead to a multitude of issues ranging from low morale to inadequate training, coaching, and feedback.
By contrast, a ratio that is too low is an indication that a service desk is “top heavy;” it has too many supervisors for the number of agents. This, in turn, leads to higher costs and specifically higher cost per ticket.
There are at least three techniques that are commonly used to determine the proper ratio of agents to supervisors. The first technique is a bottom-up modeling approach that catalogs all of the duties and responsibilities of a supervisor and then assigns a time value to each responsibility. A typical supervisor, for example, might be responsible for team meetings, agent coaching, handling overflow and/or problematic calls, working with vendors, managing or participating in projects such as improving ITIL maturity, and numerous other duties. The time commitment required for these activities can be estimated and then summed up to determine the monthly supervisory workload for the desk.
Let’s say, for example, that a particular service desk has 65 agents and an estimated supervisory workload of 1,200 hours per month. Since there are approximately 172 working hours in a month, we can estimate the supervisory headcount to be about seven (1,200 supervisory hours per month ÷ 172 work hours per month = 7 supervisors). The agent to supervisor ratio for this desk would therefore be 9.3 (65 agents ÷ 7 supervisors = 9.3 agents per supervisor).
The second approach relies upon industry benchmarks to provide guidance on the proper ratio of agents to supervisors, while the third and final approach for determining this metric is to look at confirming metrics such as agent job satisfaction. Both of these approaches are discussed below.
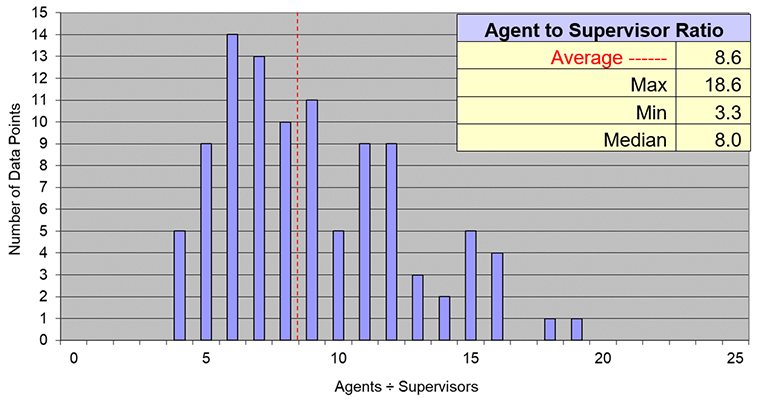
Benchmark Data for Agent to Supervisor Ratio
Industry data from MetricNet’s benchmarking database shows that the average ratio of agents to supervisors is 8.6, but ranges widely, from a high of 18.6 agents per supervisor to a low of just 3.3 agents per supervisor.
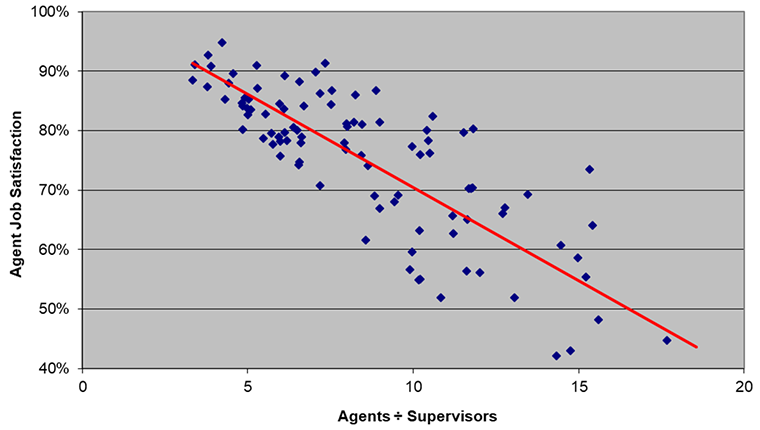
The figure below shows the relationship between agent job satisfaction and the agent to supervisor ratio. As the ratio decreases, agent job satisfaction increases, presumably because adequate supervision contributes to the agent’s morale and well-being. However, diminishing returns come into play at lower ratios, and there appears to be very little benefit in reducing the ratio to less than five agents for every supervisor.
As the agent to supervisor ratio decreases, agent job satisfaction increases.

Finally, it is worth pointing out once again that the tradeoff here is one of cost vs. the benefits of a lower ratio. While high levels of agent morale and job satisfaction are just one of the benefits of a low agent to supervisor ratio, it is important to keep in mind that the cost per contact will continue to increase as the ratio decreases.
Please join me next month for Metric of the Month: Ticket Handle Time, a workload metric that has far reaching implications for how a service desk recruits and trains its staff.
Jeff Rumburg is the winner of the 2014 Ron Muns Lifetime Achievement Award, and was named to HDI’s Top 25 Thought Leaders list for 2016. As co-founder and CEO of MetricNet, Jeff has been retained as an IT service and support expert by some of the world’s largest corporations, including American Express, Hewlett Packard, Coca-Cola, and Sony. He was formerly CEO of the Verity Group and Vice President of Gartner. Jeff received his MBA from Harvard University and his MS in Operations Research from Stanford University. Contact Jeff at
[email protected]
. Follow MetricNet on Twitter @MetricNet.