Date Published July 31, 2019 - Last Updated December 17, 2019
Each month, I highlight one Key Performance Indicator (KPI) for service and support. I define the KPI, provide recent benchmarking data for the metric, and discuss key correlations and cause-and-effect relationships for the metric. The purpose of the column is to familiarize you with the KPIs that really matter to your organization and to provide you with actionable insight on how to leverage these KPIs to improve your performance!
Last month I began this two-part series on Return on Investment (ROI) for service and support. In part 1, I defined how value is created in IT service and support. This month, in part 2, I will go through a case study that calculates the ROI for a particular support organization.
Join Jeff for an ROI workshop at Service Management World 2019.
Join us!
ROI Case Study
A mid-sized service desk at an insurance company had an operating expense of $4.8 million per year. The desk supported 8,190 users and handled 21,300 tickets per month. Through aggressive problem management, over the course of a year this service desk was able to reduce ticket volumes from 2.6 tickets per user per month to just 2.2 tickets per user per month. The table below summarizes the results of their problem management initiative.
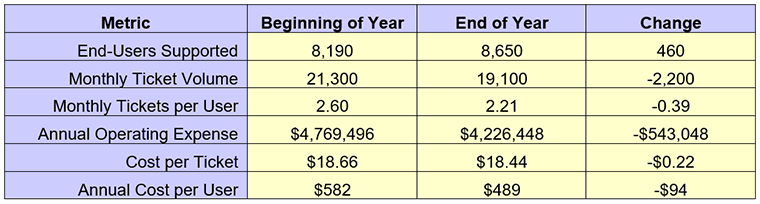
At a savings of $94 per user per year, the total savings attributable to problem management is estimated to be $813,100 ($94 annual savings per user x 8,650 users supported).
Technology can also reduce incoming contacts and hence the cost of support. Password management tools are a perfect example of this. In North America last year, password resets comprised more than 25% of all contacts to the service desk. By adopting a password management tool, a typical service desk can eliminate half or more of the resets that would otherwise be completed by a live agent. This amounts to real savings for any support organization!
Last month we discussed how service and support can make end-users more productive, as illustrated in the figure below. Moreover, the economic benefits of improved worker productivity can be quantified.
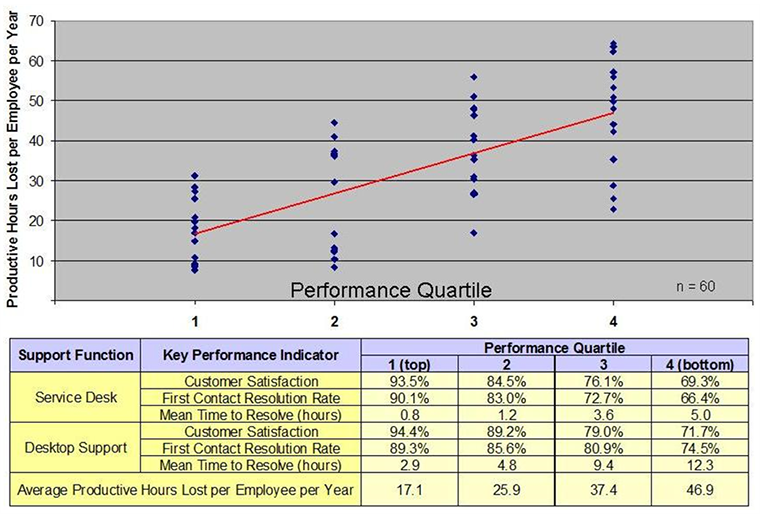
Let’s apply these productivity gains to the insurance company in our case study. We know from benchmarking the company that they are a top quartile service and support organization. We also know from the data above, explained in last month’s Metric of the Month, that the difference in lost productivity between a top quartile and an average performer is about 16 hours per user per year (33 hours of lost productivity for an average company, 17 hours of lost productivity for a top quartile performer). When multiplied by 8,650 end users, we can estimate a total labor savings of 138,400 hours per year (16 hours per year saved x 8,650 users). The average work year has about 1,700 productive hours in it, so this labor savings is the equivalent of 81 FTEs (138,400 hours per year saved ÷ 1,700 work hours per FTE per year). Finally, we know that the average cost per employee in the insurance company is $109,300 including salary and benefits. The economic value of being a top quartile support group is therefore about $8.9 million annually (81 FTEs x $109,300).
The third source of quantifiable value is the result of reducing support costs through shift left. Recent benchmarks show that the average level 1 resolution rate for North American service desks is about 82%. What this means is that 18% of all tickets that could and should have been resolved at level 1 are transferred or escalated to another source of support for resolution. These unnecessary escalations represent defects in the support process and result in increased costs that often go unnoticed because they are rarely tracked. Please note that level 1 resolution is not the same thing as first contact resolution. Level 1 resolution is the number of tickets resolved by the service desk divided by all tickets that can potentially be resolved by the service desk, regardless of whether the ticket is resolved on first contact or not.
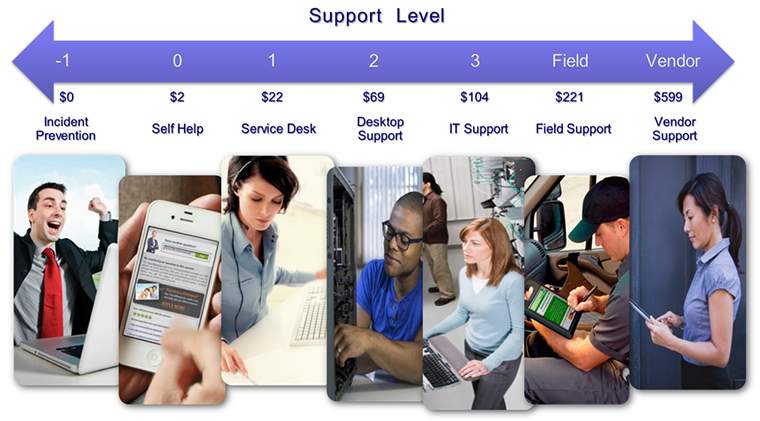
As shown in the figure below, the cost of resolution increases with each successive ticket transfer to a higher level of support. The insurance company in our case study had an impressive 93% first level resolution rate. That is 11 percentage points higher than the industry average and equates to resolving an additional 25,212 tickets per year at level 1 vs. the industry average (93% FLR vs. 82% FLR) x (19,100 tickets/month x 12 months). If we now multiply this by the difference in cost between tickets resolved at level 1 vs. tickets resolved at level 2, we can estimate a cost savings of $1,008,480 per year: 25,212 tickets per year X $40 per ticket ($62 per ticket at level 2 vs $22 per ticket at level 1).
Once again, technology can play a role in reducing an organization’s service and support costs. Knowledge management and remote diagnostic tools are among the most common technologies used to improve first level resolution rates and hence reduce TCO.
Now let’s take a look at how channel mix, and specifically deflecting contacts into lower cost channels, can contribute to the ROI of service and support. In the first year that the insurance company implemented its self-help portal, an estimated 33,000 incidents were user-resolved through self-help. From the diagram above, we know that the average cost of a self-help incident is about $2, while the average cost of an agent-assisted incident at level 1 is about $22. We can therefore reasonably assume that the 33,000 tickets that were self-resolved produced a savings of $660,000 (33,000 self-resolved incidents x $20 savings per self-resolved incident).
To conclude our case study, let’s sum up the economic value delivered by the service desk at the insurance company. We have the following estimated cost savings:
$0.8 million saved through problem management
+ $8.9 million in returned productivity to end users
+ $1 million saved by maximizing first level resolution
+ $0.7 million saved through the self-help portal
_____________________________________________________
Total Economic Value = $11.4 million annually
With an estimated cost savings of $11.4 million and an annual operating expense of $4.2 million, this support organization is indeed producing economic value far in excess of its costs. Specifically, the ROI for this service desk is 271% ($11.4 million in savings ÷ $4.2 million in annual operating expense).
The ROI Challenge
I have spent almost three decades working in the IT service and support industry as a consultant, author, and speaker. Much has changed since I first heard the term “help desk” almost 30 years ago. But one thing that hasn’t changed is that most IT service and support organizations are still viewed and managed as cost centers. Simply put, a cost center is responsible for managing its costs, but is not responsible for generating revenue, profits, or making investment decisions.
Most IT service and support organizations are still viewed and managed as cost centers.

Being a cost center carries with it a number of negative connotations. It suggests that little if any intrinsic value is being created by IT service and support and that they cannot be trusted to use their resources wisely. It is therefore no surprise that many service and support organizations feel that they lack adequate resources, as well as the management commitment and backing to deliver consistently high-quality results. Moreover, support organizations that do lack adequate resources tend to operate tactically, often lurching chaotically from one crisis to the next.
Fortunately, there is an alternative, a proven approach that can transform your tactical support center into a strategically focused organization that creates demonstrable economic value for the enterprise. In order to embark upon this transformation, you must understand and clearly articulate the ROI of service and support. While this may take some of you out of your comfort zone, the alternative—a tactical, subsistence-level support organization—should be motivation enough to overcome any hesitancy you might have about calculating and boldly communicating your ROI. This is crucial if you wish to transform IT service and support from a tactical cost center into a strategic source of value creation for the enterprise.
Please join me for next month’s Metric of the Month: Customer Experience, where I will present three critical metrics that comprise the customer experience.
Jeff Rumburg is the winner of the 2014 Ron Muns Lifetime Achievement Award, and was named to HDI’s Top 25 Thought Leaders list for 2018. As co-founder and CEO of MetricNet, Jeff has been retained as an IT service and support expert by some of the world’s largest corporations, including American Express, Hewlett Packard, Coca-Cola, and Sony. He was formerly CEO of the Verity Group and Vice President of Gartner. Jeff received his MBA from Harvard University and his MS in Operations Research from Stanford University. Contact Jeff at
[email protected]
. Follow MetricNet on Twitter @MetricNet.