Date Published August 26, 2020 - Last Updated January 20, 2023
Each month, I highlight one Key Performance Indicator (KPI) for service and support. I define the KPI, provide recent benchmarking data for the metric, and discuss key correlations and cause-and-effect relationships for the metric. The purpose of the column is to familiarize you with the KPIs that really matter to your organization and to provide you with actionable insight on how to leverage these KPIs to improve your performance!
This month, I depart from my usual format. Instead of discussing a single metric, I will be discussing the critical linkage that exists between process maturity and overall performance in IT service and support.
Process Drives Performance!
We’ve all heard the joke about insanity. It’s defined as doing the same thing over and over again but expecting a different result. In IT support, it’s not hard to find organizations that behave this way. They get stuck in old habits, delivering services the same way they always have, and are surprised that longstanding challenges never seem to get resolved. But the key to getting better results, and the key to resolving challenges, is to change and improve the way you do things.
I recently benchmarked a service desk that had a first contact resolution rate (FCR) of just 61%. We know from a prior Metric of the Month that customer satisfaction is strongly correlated with FCR. Sure enough, this service desk also had a low customer satisfaction score; just 74% of customers were either satisfied or very satisfied.
The obvious question is, how do we fix this? How can we achieve a higher FCR and in turn improve our customer satisfaction scores? Do we simply have to accept that this service desk has low FCR and CSAT scores? Is there a better way? The answer is no, we don’t have to accept it, and yes, there is a better way. Let’s think about some of the obvious ways to improve first contact resolution rate:
- Establish a stretch goal for FCR and provide incentives for analysts working in the service desk to achieve the goal. I would suggest a performance target of 84% FCR, which would put this service desk in the top quartile for the industry. Moreover, simply establishing a performance target often has the effect of improving an organizations performance vis-à-vis the goal.
- On a monthly basis, audit tickets that are not resolved on first contact and provide analyst training that is specifically designed to increase the FCR for the largest categories of tickets that are being escalated.
- Update or create knowledge articles that are associated with the largest categories of escalated tickets.
- If the service desk does not have a remote-control tool, consider adopting such a tool to increase the resolution rate on first contact.
- If the service desk has a handle time target, eliminate the target and give analysts the discretion to decide when to transfer or escalate the ticket. Handle time targets almost always have negative consequences, including reduced FCR.
- If calls are being escalated or transferred prematurely due to short staffing in the service desk, the problem can be corrected by adding additional staff. This happens all too often, unfortunately. When service desks are under extreme cost pressure, they will frequently be understaffed. The result is that tickets shift right (not left), and are transferred or escalated to desktop support, level 3 IT, field services, or vendor support even if they are capable of being resolved at level 1. In these circumstances, the cost per ticket at level 1 may be low, but the total cost of ownership (TCO), including all levels of support, will increase many times more than the cost savings at level 1.
These are common remedies to the decades old challenge of increasing FCR. Enterprises that actively pursue these policies typically see a substantial improvement in first contact resolution and customer satisfaction. This not only reduces the total cost of ownership by shifting tickets to the left, it also gets the customer back to full productivity more quickly!
I have written in the past about better, faster, and cheaper outcomes. The remedies discussed above have a direct and positive impact on each of the associated success metrics: customer satisfaction, MTTR, and TCO per ticket. Moreover, this is just one small example in one service desk. Imagine the results of applying this same logic across all tasks performed by IT service and support. The cumulative benefits throughout the enterprise would be truly staggering!
Benchmark Data for Process Drives Performance
The chart below contains benchmarking data that illustrates the relationship between process maturity and overall performance for a typical service desk. The x-axis shows process maturity on a scale of 0% to 100%, while the y-axis shows the balanced score, also on a scale of 0% to 100%. The balanced scorecard was the subject of a prior Metric of the Month. For now, it is sufficient to point out that the higher the balanced score, the better the overall performance of the service desk in question.
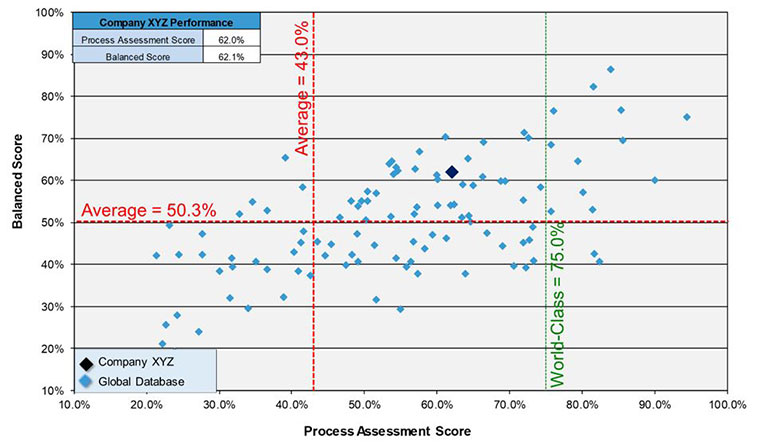
Process maturity is measured using an assessment that was developed by MetricNet nearly 20 years ago and is updated annually. The process areas included in the assessment are strategy, human resource management, ticket handling, technology, metrics and measurement, and stakeholder communication. The higher the process score, x-axis, the more mature the underlying processes are.
In math, the x-axis is also called the independent variable, while the y-axis is called the dependent variable. Another way of thinking about this is that x drives y. X is your input, while y is our output. In this case the input, x-axis, is process maturity, while the output, y-axis, is the balanced score. The blue diamonds in the chart are data points. The correlation is clear: as processes become more mature (move to the right on the x-axis), you get better outcomes (move up the y-axis). This is no coincidence. Rather, it is the empirical proof that process does indeed drive performance!
An even more important point is that you have a great deal of control over your process maturity. Your leverage on this chart is on the x-axis. As you mature your strategy, human resources, ticket handling, technology, metrics and communication, you will move to the right on the x-axis. This, in turn, will bring about better, faster, cheaper outcomes; you will move up the y-axis. This is your ultimate ace in the hole! Your performance is not a matter of chance or luck. Rather, it is entirely dependent upon how effectively you adopt and mature the industry’s best demonstrated practices!
Driving Process Maturity
The best way to drive process maturity and increase overall performance in IT service and support is to first establish performance targets for each metric that you track, and then mature the underlying processes that drive these metrics. The case study we went through above was geared towards improved FCR and CSAT, but the methodology is equally applicable for driving continuous improvement in any other metric. You can use it to improve your mean time to resolve (MTTR), reduce your cost per ticket, increase the user self-help/self-service rate, or achieve any other performance objective.
In a prior Metric of the Month I wrote about the cause-and-effect relationships—the metrics ecosystem, if you will—that exist for both service desks and desktop support. I’ve reproduced that diagram in the figure below to emphasize the interconnectedness of the metrics of IT support.
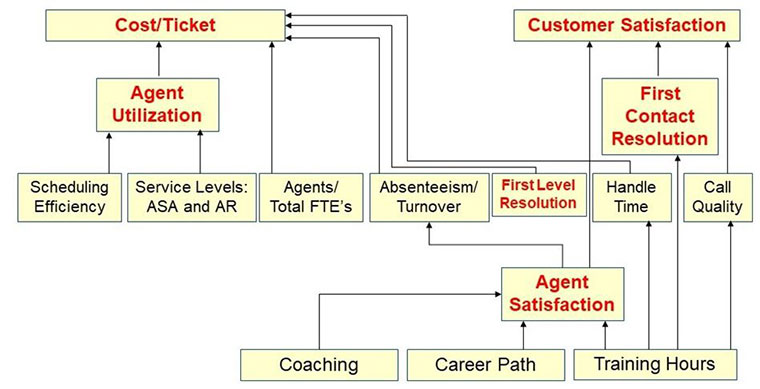
Pick any metric that you wish to improve, and it becomes almost immediately obvious how to do that. Take analyst job satisfaction, for example. Thankfully, the service and support industry has begun to view this as an important metric, not just some “motherhood and apple pie” nice-to-have metric.
We care about job satisfaction because it has a direct impact on customer satisfaction and helps to minimize turnover and absenteeism. Moreover, the diagram shows that we can control (improve) this metric through coaching, career pathing, and training, all of which are processes that you can mature over time!
This kind of performance improvement requires action that leads to more mature processes and better outcomes. Process and performance really are two sides of the same coin. They are inextricably linked. Hence, the industry truism that process drives performance! Performance gains don’t happen by accident. Instead, they are the result of concerted efforts to adopt the industry’s best demonstrated practices and then continuously improve upon and mature them.
Performance gains don’t happen by accident.

I encourage you to incorporate process thinking into any discussion of performance for your support organization. Once you understand and apply the paradigm of “Process Drives Performance” there is no challenge that is too daunting when you mature the processes that drive performance!
Please join me for next month’s Metric of the Month: The Metrics of AI, where I will explore the unique metrics associated with artificial intelligence in IT service and support.
Jeff Rumburg is the winner of the 2014 Ron Muns Lifetime Achievement Award, and was named to HDI’s Top 25 Thought Leaders. As co-founder and CEO of MetricNet, Jeff has been retained as an IT service and support expert by some of the world’s largest corporations, including American Express, Hewlett Packard, Coca-Cola, and Sony. He was formerly CEO of the Verity Group and Vice President of Gartner. Jeff received his MBA from Harvard University and his MS in Operations Research from Stanford University. Contact Jeff at
[email protected]
. Follow MetricNet on Twitter @MetricNet.