Date Published June 23, 2020 - Last Updated October 10, 2024
Each month, I highlight one Key Performance Indicator (KPI) for service and support. I define the KPI, provide recent benchmarking data for the metric, and discuss key correlations and cause-and-effect relationships for the metric. The purpose of the column is to familiarize you with the KPIs that really matter to your organization and to provide you with actionable insight on how to leverage these KPIs to improve your performance! This month, I look at ticket quality.
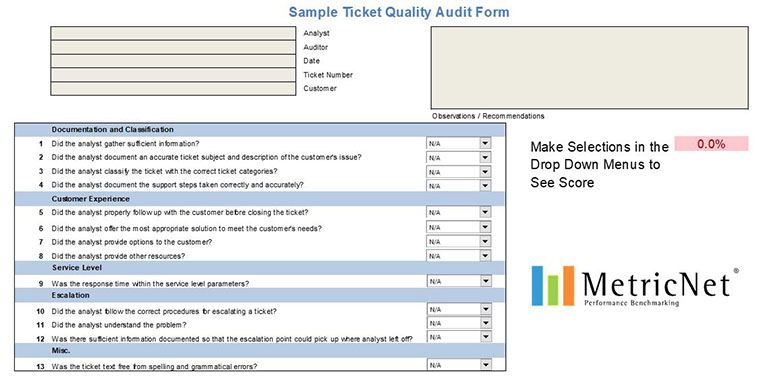
Ticket quality is measured on a scale of 0% to 100%. It can and should be measured at all levels of support—the level 1 service desk, desktop support, field services, and level 3 IT. Much like call quality, ticket quality is measured by sampling a random set of tickets each month and grading them based on several criteria. Some of the more common ticket quality criteria include the following:
- Quality and completeness of ticket description field
- Proper categorization of ticket (e.g., category, type, configuration item)
- Ticket priority and urgency categorized correctly
- Proper knowledge article attached
- Accurate solution identified
- Ticket attached to a known problem, or a new problem is created for the ticket
- Incident management protocol followed
- Proper point of escalation identified
- Ticket closed in a timely manner
- Overall completeness and clarity of ticket
Many of these criteria are subjective, so the overall ticket quality metric is also somewhat subjective. I show a sample ticket quality evaluation form in the figure below:

Why It’s Important
Poor ticket quality is a serious problem in the service and support industry. Imagine being a desktop tech or a level 3 applications engineer and receiving a ticket in your queue that simply says, “computer broken,” and the ticket is categorized as “other.” While this may seem humorous, it is not uncommon. Moreover, poor ticket quality creates a plethora of related problems.
In this particular example, the level 3 applications engineer will most likely have to call the service desk to get further details on the customer’s issue and might also have to call the customer and have them repeat information that should have been captured in the original ticket. Needless to say, this leads to frustration for the customer and delays resolution of the incident or service request. Poor ticket quality has been shown to increase the number of “ticket hops” before resolution, increase the MTTR (mean time to resolve), and negatively impact customer satisfaction.
ITIL practices such as knowledge, incident, and problem management are highly dependent upon ticket quality. The quality, effectiveness, and maturity of your knowledge discipline depends on the accuracy and completeness of your tickets. Likewise, problem management can only be effective when there are high quality tickets that enable the diagnosis of root causes. And incident management will simply not be effective if tickets lack the information necessary for proper routing and diagnosis.
In addition to measuring ticket quality at the service desk, desktop support, and other support levels, the industry rule-of-thumb is that each analyst or technician is graded on four tickets per month. In a typical monthly coaching session, an analyst might be evaluated on their call or chat quality, their balanced scorecard, and their ticket quality.
Benchmark Data for Ticket Quality
Ticket quality is currently tracked by approximately 25% of all support organizations. But it is rapidly gaining acceptance as a mainstream metric due to the impact it has on cost, quality, resolution time, and ITIL maturity. The benchmarking average and ranges for ticket quality are shown in the table below.

Much like call quality, there is no standard criteria for measuring ticket quality. Virtually every support organization measures ticket quality somewhat differently. As a result, the variance in ticket quality from one organization to the next can be quite large. One organization’s 95% ticket quality might be another organization’s 80% ticket quality. This should not be an issue, however, since you are likely to be more interested in the trend of your ticket quality rather than how you compare to the ticket quality of other organizations.
Managing Ticket Quality
If you have never tracked ticket quality, I would encourage you to adopt this metric and set a performance target for ticket quality. The mere act of adopting and raising the visibility of this metric will have the effect of improving ticket quality.
As ticket quality improves, you should see corresponding improvements in MTTR, customer satisfaction, and ticket hops. Additionally, as ticket quality improves, the maturity of ITIL practices—particularly knowledge, problem, and incident management—will also improve.
As ticket quality improves, the maturity of ITIL practices will also improve.

Please join me for next month’s Metric of the Month: Same Day/Next Day Resolution, a desktop support and field services metric that has gained widespread acceptance in recent years and is viewed as a more intuitive service level metric than MTTR.
Jeff Rumburg is the winner of the 2014 Ron Muns Lifetime Achievement Award, and was named to HDI’s Top 25 Thought Leaders. As co-founder and CEO of MetricNet, Jeff has been retained as an IT service and support expert by some of the world’s largest corporations, including American Express, Hewlett Packard, Coca-Cola, and Sony. He was formerly CEO of the Verity Group and Vice President of Gartner. Jeff received his MBA from Harvard University and his MS in Operations Research from Stanford University. Contact Jeff at
[email protected]
. Follow MetricNet on Twitter @MetricNet.