Date Published August 24, 2021 - Last Updated January 20, 2023
As an IT service desk manager, the use of XLAs – eXperience level agreements – is probably something that you’re hearing in more and more conversations. This blog explains why XLAs and experience-related targets should be used as a key indicator of how well your IT service desk is meeting business and employee needs and outcomes.
Taking the pulse of the perceptions of IT service desk performance
How often do you get told – either directly or indirectly – about people’s IT support horror stories? Things don’t add up, because your IT service desk’s performance metrics consistently show that the agreed-on service-level targets are being met, and often exceeded.
To understand this discrepancy, there’s a need to appreciate what’s currently being measured and how. For example, do your IT service desk performance metrics measure how well things are being done operationally – let’s call this the “mechanics” of IT support – rather than assessing the outcomes for, and the experiences of, the employees being served? If so, that’s why there’s a gap – which can be called a perceptions gap, expectations gap, experience gap, or something else – between the IT service desk’s own measurement of its performance and what end users think or perceive it to be.
This gap is exactly why organizations and their IT service desks are employing XLAs – because they allow the service provider to better understand how well business and employee needs are being met. If used correctly, they can drive the right improvements to close the gap between the demand-side and supply-side views of performance.
Why IT service desk managers need the insight and improvement opportunities provided by XLAs
Your IT service desk likely already has more than enough performance metrics. However, a key point with XLAs is that they’re not about measuring even more operationally-focused data points. Instead, they’re about measuring the “most important things” or “the right things,” from an experience and outcomes perspective, such that you can then align your improvement activities to what matters most to your organization and its employees.
This is an important distinction because measuring performance simply to show that agreed-on service targets have been met misunderstands a key purpose of metrics – to enable the improvement of both operations and outcomes.
When considering the use of XLAs, a telling question is – are you confident that your IT service desk is measuring the right things? Or, while your key performance indicators (KPIs) might show that all is good – or at least acceptable – is the informal feedback highlighting that the needs of your organization’s employees are not being suitably met? Then, if things aren’t perhaps as they need to be, can you see what’s causing the issue(s)? If the answer to the last question is “no,” then this is why you, as a manager of an IT service desk, need XLAs.
XLAs and employee experience management in action
To play Devil’s Advocate for a moment, people might think that customer satisfaction (CSAT) is sufficient to measure what employees think about the service and support they received from their IT service desk. But, as with the other IT service desk KPIs that are consistently “showing green,” your CSAT score might not be a great indicator of what employees feel about the service and support they receive. This is especially true when the CSAT questionnaires ask questions related to the “mechanics” of IT support rather than the end-user experience.
The corporate IT service desk faces similar issues to the business-to-consumer (B2C) and business-to-business (B2B) companies that have moved from traditional CSAT questionnaires to measuring net promoter score (NPS) over the last decade. The “insight” provided from CSAT surveys was masking both how customers really feel about doing business with the companies plus the underlying root causes of their issues. The same is true for IT service desks and the employees they serve.
A quick way to demonstrate the opportunity is to share some of our latest experience data. The results shown in the table below are based on HappySignals customers' data and are a rolling six-month average ending at the end of the indicated period. Here, it’s important to note that this is for HappySignals customers who have already invested in identifying and addressing experience-related issues rather than for IT service providers per se.
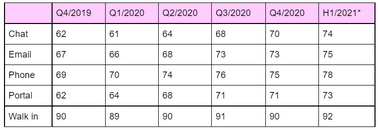
*1.12.2020-31.5.2021
Source: HappySignals, The Global IT Experience Benchmark H1/2021
You’ll notice that employee happiness differs across different support channels and has increased significantly over the last 18 months thanks to the improvements made by the IT service providers.
Now ask yourself, “How has our use of traditional IT service desk metrics, including CSAT, improved things for employees over the last 18 months?” And remember that this is your supply-side view and not necessarily a true view of what employees see and feel.
What has happened in the above data is that, through the use of XLAs and experience-based metrics, the IT service providers have been able to better understand what’s happening – both good, neutral, and bad – at key employee touchpoints. And because of this, investments in improvement – to IT support operations, services, and outcomes – have been made in the right places, especially in addressing the underlying root causes of the issues rather than the more obvious symptoms.
For example, the same feedback data shows that the top-three key factors creating poor employee experiences are:
- Their issue not being solved despite ticket closure
- Slowness of service
- Having to reexplain the issue and provide details repeatedly, i.e. being bounced between people.
- Versus the top-three factors creating great employee experiences:
- Speed of service
- Service personnel’s attitude
- Service personnel’s skills
It’s hopefully more data-driven insight – especially the poor-experience factors – that make you wonder about how well your IT service desk is really doing and what traditional service desk metrics mask in terms of the employee experience.
Sami Kallio is CEO and co-founder of HappySignals. Before starting HappySignals, he worked as the CEO of Palmu.exe, a service design company. Before that, he was responsible for the service design unit at Tieto Corporation. He believes happiness and productivity are the keys to transforming business IT culture for the better.