Date Published December 28, 2021 - Last Updated October 10, 2024
Each month MetricNet highlights one Key Performance Indicator for Service and Support. We define the KPI, provide recent benchmarking data for the metric, and discuss key correlations, and cause-and-effect relationships for the metric. The purpose of the column is to familiarize you with the Key Performance Indicators that really matter to your organization, and to provide you with actionable insight on how to leverage these KPIs to improve your performance
This month, we’re taking another look at cost per ticket.
Cost per unit is a common metric throughout our economy. Many of you know the cost of a gallon of gas, or the cost for a cup of coffee, or the cost of your monthly cell phone plan. Yet surprisingly, many service and support managers do not know their own Cost per Ticket.
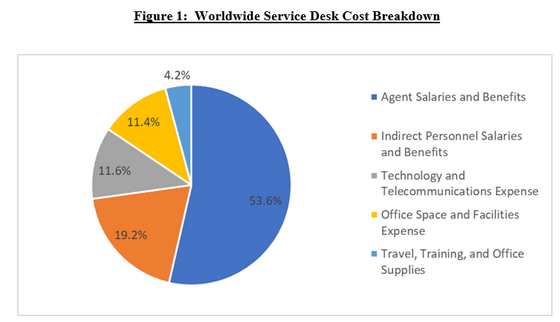
Cost per Ticket is the total monthly operating expense of a service desk divided by the monthly ticket volume. Operating expense includes the following components:
- Salaries and Benefits for service desk agents
- Salaries and Benefits for Indirect Personnel (Team Leads, Supervisors, Workforce Schedulers, Dispatchers, QA/QC Personnel, Trainers, and Managers)
- Technology and Telecom Expense (computers, software licensing fees, ACD and VRU costs, telecom headsets and handsets, etc.)
- Facilities Expense (office space, utilities, insurance, etc.)
- Travel, Training, and Office Supplies
Service and support is a labor-intensive function. As you might expect, the vast majority of costs for a service desk are personnel related. Figure 1 below shows the average cost breakdown for service desks worldwide in 2021. This cost breakdown remains relatively constant from country to country, and from region to region.
Why it’s Important
Cost per Ticket and Customer Satisfaction are often referred to as the foundation metrics in service and support. They are the two most important metrics because ultimately everything boils down to cost containment (as measured by Cost per Ticket), and quality of service (as measured by Customer Satisfaction).
In any service delivery organization, cost (or more accurately unit cost) is critically important. Cost per Ticket is a measure of how efficiently a service desk conducts its business. A higher-than-average Cost per Ticket is not necessarily a bad thing, particularly if it helps to drive higher than average customer satisfaction and service levels. Conversely, a low Cost per Ticket is not necessarily good, particularly if the low cost is achieved by sacrificing service levels or customer satisfaction. Every service desk should track and trend Cost per Ticket on a monthly basis.
Key Drivers of Service Desk Cost per Ticket
Borrowing the cause-and-effect diagram from a previous Metric of the Month, we can see that Cost per Ticket has a number of key drivers. The most important of these drivers are Agent Utilization and Ticket Handle Time. Secondary drivers include Absenteeism, Turnover, and the Ratio of Agents to Total Service Desk Headcount. These KPIs have been highlighted in the diagram below.
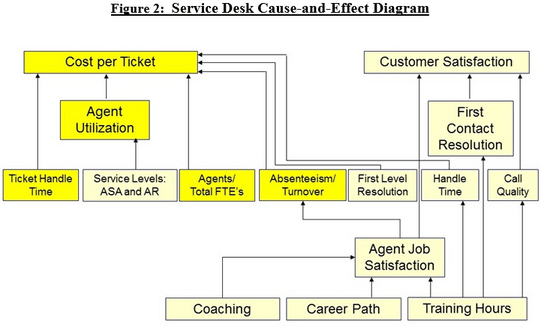
The correlation between Ticket Handle Time and Cost per Ticket, and between Agent Utilization and Cost per Ticket is illustrated in the two charts below.

The relationship between handle time and Cost per Ticket is fairly intuitive. Increasing handle times mean increasing work per ticket, and for a labor-intensive function, that means costs will increase correspondingly. But what accounts for the wide variation around the mean? Why is the cost for a ten-minute ticket $10 for one service desk and $25 for another service desk? The answer is wage rates. Specifically, the wide variation in wage rates within a country. As wage rates vary, so too will Cost per Ticket. Operating a service desk in a geographic location with lower average wage rates will result in a lower average Cost per Ticket. Conversely, operating a service desk in a major metropolitan area where wages tend to be much higher, will produce a much higher Cost per Ticket.
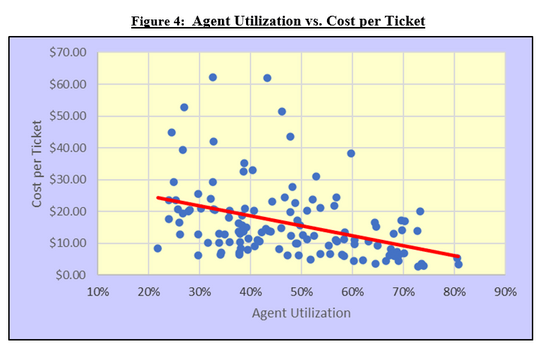
The relationship between Agent Utilization and Cost per Ticket is also intuitive. Higher utilization means greater productivity and lower costs. The variance around the mean for this chart is even greater than for Cost vs. Handle Time. The reason is that in the utilization chart we have not normalized for Handle time. So, it’s possible to have a $10 ticket at 50% utilization as well as a $50 ticket at 50% utilization if the handle time for the $50 ticket is 5X the handle time for the $10 ticket.
What about the secondary drivers of cost – absenteeism, turnover, and the ratio of Agents to Total Headcount? Absenteeism increases costs because a service desk will need to offer overtime hours or retain additional staff in an amount equal to the absentee rate. Let’s say, for example, that a service desk has an average absentee rate of 5%. That means they will be operating at 95% capacity and will need to add additional headcount or offer overtime hours to make up for the 5% capacity shortfall.
Turnover is costly because, on average, it costs about $12,000 to replace a single service desk agent in North America. This is the cost of finding a suitable candidate, background checking them, training them, and finally the learning curve costs once the agent starts working on the desk.
Finally, the Ratio of Agents to Total Service Desk Headcount is a measure of managerial efficiency. The average for this metric worldwide is about 78%. What this means is that 78% of service desk personnel are in direct, customer facing service roles. The remaining 22% are supervisors, team leads, trainers, schedulers, QA/QC personnel, etc. If this number is much lower than 78% it means that the service desk is top heavy; it has too many indirect personnel. If the number is too high, it means that the managerial span of control is not tight enough, and there may be a lack of supervision.
Channel Effects on Cost per Ticket
Virtually every service desk is now multi-channel if not omni-channel. The most common channels include voice, chat, email, web submit, self-help, and walk-up. Some channels are more efficient than others, so naturally the cost per ticket will vary by channel. The most expensive channel is walk-up because the average ticket handle time is longest in the walk-up channel. Voice is still the dominant channel in the industry and has the second highest cost per ticket. Chat is lower cost than voice because a good chat agent can handle more than one chat at a time. This is called concurrency, and it increases the utilization rate of chat agents relative to voice agents. Email and web submitted tickets are also lower cost than voice tickets because the Erlang effects of the incoming ticket flow (the peaks and valleys) are not as severe as they are in the voice channel. This also has the effect of driving utilization rates higher for email and web agents. Finally, self-help tickets are the lowest cost of all since they involve no agent assistance. These economics help to explain why many service desks devote considerable effort to deflecting tickets away from the voice channel and into the lower cost channels of chat, email, web, and self-help.
Benchmarking Ranges for Cost per Ticket
The North American averages and ranges for Cost per Ticket by channel in 2021 are shown below, in Figure 5.
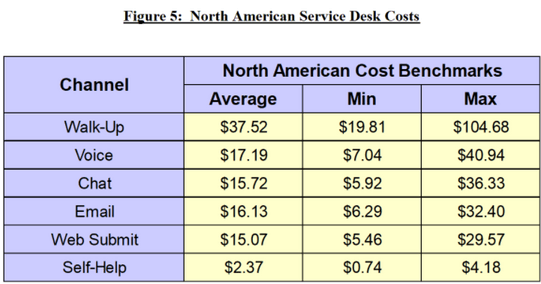
The ranges for Cost per Ticket (min to max) are quite large, varying by more than two orders of magnitude (100X) from the lowest cost self-help ticket to the highest cost walk-up ticket. The reasons for this have been explained above, and include variations in handle time by channel, wage rates, agent utilization, absenteeism, turnover, and the Ratio of Agents to Total Service Desk Headcount.
Jeff Rumburg is the Managing Partner and co-founder of MetricNet, LLC. MetricNet is the leading source of benchmarks and metrics for IT service and support professionals worldwide. For more information, please go to www.metricnet.com.