Date Published January 1, 2017 - Last Updated December 15, 2016
There are many things we can measure in IT, but which things should we measure? And which should we report? The simple answer is that we should report the measures and metrics that provide value to the recipients. This is summed up in the oft-used quartet:
What is not defined, cannot be measured.
What is not measured, cannot be controlled.
What is not controlled, cannot be improved.
What cannot be improved, cannot continue to provide value.
Before we can begin to distribute reports of measures and metrics, we should understand what those measures are. Measures and metrics can be categorized in several ways. Here are a few distinctions of which we should be aware.
Understand the Terminology
A measure is a quantifiable expression of performance collected during the execution of activities. A metric is a specific measurement or calculation associated with performance. Metrics are repeated measures that are applied as references for assessing variance as compared to a defined target. A baseline is a point-in-time measure of a known state or performance level that is used as a reference for subsequent measurements. Key performance indicators (KPIs) are metrics used to show progress toward a specified goal or critical success factor (CSF).
Here is an example of the differences. When our service desk does a simple count of the number of issues reported in a day, we have a measure. If that measure is compared to previous results of the same measure, we have a metric. If those metrics are compared against a point in time measure, that point in time measure is our baseline. We then use those metrics (as a KPI) to compare against a target number designed to support our goal of operational effectiveness and efficiency (our CSF).
Measures can be either leading or lagging. Leading measures drive or lead to the performance of lag measures, normally measuring intermediate processes and activities. Leading measures are generally input oriented and predictive of likely performance. Some examples are average speed of answer, average handle time, and first call resolution. Lagging (or trailing) measures focus on results at the end of a time period, normally characterizing historical performance. Lagging measures are generally output oriented and historical in nature, describing how we performed. Examples include total customer contacts, total incidents, and customer satisfaction.
Polarity is another aspect of measures that needs to be understood, especially when devising targets. Polarity indicates whether a desired, or target, value is high or low on a scale. Some metrics (such as average speed of answer) are usually better when the value is lower—30 seconds compared to 120 seconds. Other metrics (such as first call resolution) are generally better when the value is higher—FCR of 80 percent compared to 60 percent. Still other measures may require dual polarity. With these measures, too low a value is bad, but too high a value is also bad. When employing these measures, we are searching for the “sweet spot.” The prime example here is employee utilization; we want our employees working, but we don’t want them to burn out.
There are several types of metrics. Technology metrics are related to components and applications, such as server uptime or network bandwidth. While they are crucial for effective and efficient service delivery, technology metrics are of little interest to customers. Process metrics apply to the overall health of a process, such as average time to fulfill service requests or average time to process a change request. They indicate how well individual processes are performing. A service metric is the customer’s view of a service, as service metrics provide insight into the end-to-end performance of a service. This includes availability of the service to the customer or the mean time to restore a customer’s access to a service.
Measures and metrics can also be described as either quantitative or qualitative. We’ll refer to this distinction as the kind of measure. Quantitative measures are hard measures based on data and numbers. These are usually financial or operational measures. Qualitative measures are the softer measures based on intangible or subjective data, such as customer comments or perceptions.
There are also four categories of measures and metrics. Compliance measures indicate whether or not an activity is being done: Are all requests being logged? Quality measures describe how well we are doing a given task: For the requests logged, are sufficient details entered for resolving the request? Performance measures show how quickly or slowly we are doing an indicated activity: How quickly are we resolving service requests? Value measures address whether the tasks we are doing are making a difference for the stakeholders: How satisfied are the customers with our service request resolutions?
Build a Measurement Dictionary
Now that we know some of the many ways we can describe measures and metrics, we can now build our dictionary of measures and metrics. Our dictionary should include the following attributes. Each entry in our dictionary should have a unique measure name. The entry should include a description of the measure, including the context, purpose, and impact. We should include the polarity, whether the measure is leading or lagging, the measure kind (quantitative or qualitative), the measure category (compliance, quality, performance, or value), and the measure type (technology, process, or service).
Our dictionary should include the unit measure, such as percentage, number of calls, or time. Include the measure’s definition or how to calculate the result. When possible, include any applicable database queries. Also list the sources of your data, such as ticketing tool, call distribution tool, satisfaction survey tool, or manually collected data.
Select Metrics to Measure
One popular mechanism for selecting and reporting metrics is the balanced scorecard, introduced by Kaplan and Norton. The balanced scorecard advises us to look at the organization’s performance from multiple angles. Typical balanced scorecards report on the achievement of goals in four areas. Most scorecards include a financial area which describes the financial objectives and success factors of the organization. This area would include metrics relating to cost, income, and savings. The customer area focuses on success with respect to customers and users. The operational excellence area focuses on internal items such as employee satisfaction and process effectiveness and efficiency. The future orientation area of the scorecard addresses success from the perspective of improvement, learning, and growth. While these are four common areas, the balanced scorecard should be developed to holistically address the needs and concerns of your organization.
For more insights on the balanced scorecard, read Doug Tedder’s Creating a Balanced Scorecard
The balanced scorecard gives us a mechanism for selecting a variety of metrics to help describe progress toward success. But we must define what that success looks like for the organization. Using the metrics tree below, we can select the appropriate metrics to show that we are progressing toward the CSFs that directly support the mission and vision of the organization.
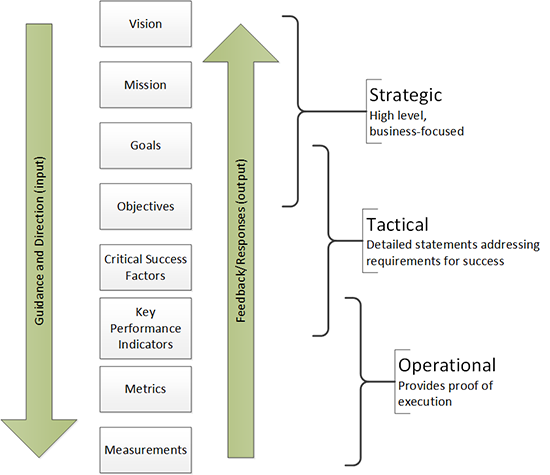
When selecting metrics, we need to make sure we are not focusing too narrowly on a small number of measures. We need to get a more complete and holistic view than is possible from a single metric or even a single type of metric. The KPIs included on our balanced scorecard should include a mix of categories (compliance, quality, performance, value), types (technology, process, service), and kinds (quantitative, qualitative), as well as a combination of lagging and leading indicators.
If we take a look at HDI’s sample balanced scorecard, we see this mix. It has leading (average speed of answer, average customers/FTE) and lagging (total incidents closed, employee satisfaction) indicators. It has qualitative (customer satisfaction rating, employee satisfaction rating) and quantitative (total calls answered, training hours) metrics. The sample scorecard has compliance (support center certification), quality (average training hours/fte), performance (time to employee proficiency), and value (customer satisfaction rating) measures. It also has a mix of technology (total calls answered), process (time to employee proficiency), and service (customer satisfaction) metrics.
HDI members can download a sample scorecard for a support center at HDIConnect. Not a member? Join today!
We must keep in mind that metrics are not singular and isolated. Focusing on one metric could adversely impact other metrics. For example, suppose management chooses to focus on an aggressive average speed of answer. In a vacuum, reducing the ASA is generally a good thing. However, representatives will strive to meet that imposed ASA target, possibly at the expense of the customer experience. By answering the call and almost immediately putting the caller on hold, the ASA target is met. But hold times, handle times, and other operational measures could suffer. We need to know how the tension between these metrics can be optimized for the best possible customer experience given organizational parameters such as staffing and cost.
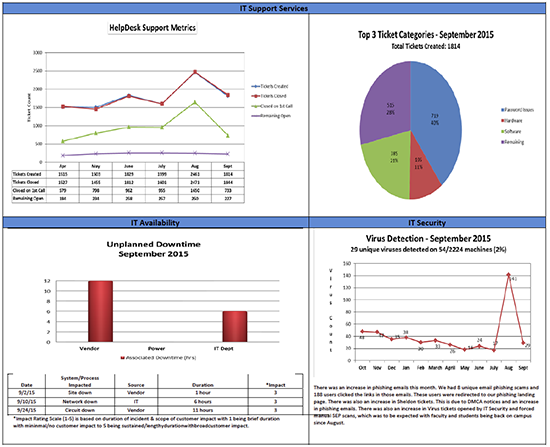
Our organization is continually evolving its operational dashboard into a balanced scorecard. Included on the current version of this report are incident counts taken on the same date each month, presented as a comparison of the current month with the previous five months in both graph and tabular format. Another item included is the types and durations of unplanned downtime. We graphically represent the durations of the three types of outages important to us: vendor outages (such as hosting and internet providers), power issues, and issues under the direct purview of our internal IT department (such as local servers and internal networking). We also call out each major incident with its duration and relative impact in tabular format to add context to the graphical presentation.
When reporting metrics, we need to know our target audience, such as internal operations, management, leadership, regulatory oversight, etc. We should also report the metrics using a mechanism appropriate for the audience, such as text, spreadsheets, charts, or graphs. We should be sure that the audience is using the metrics presented to make an informed decision. If there is no decision to be made, we need to ask why the recipient needs the metric reported. This may help reduce unnecessary effort that could be better directed elsewhere. It might also help prevent confusion for the recipient about how to interpret and act on the data.
You’ll note that we include virus detections as a simple chart in our operational scorecard. This shows the business (the audience of this report) some insight into the support center’s workload. As a university, we also deal with issues relating to disciplinary actions for students. Reports with such details would be available to our student and judicial affairs offices.
Create a Metrics Catalog
Much like a service catalog documents information about services in the organization, we should create a catalog of our metrics. Now that we have defined the metrics in our environment, we can flesh out the records and evolve our metrics dictionary into our metrics catalog. This catalog should identify not just the parameters of the metric. It should include linkages to scorecard goals, strategies, and objectives. The catalog should include information about audiences, delivery mechanisms, and frequency. We should include a baseline, targets, and rationale for those targets. We should include possible actions when the identified targets are achieved and when those targets are not achieved.
Having this catalog of metrics allows those with access to the catalog a more complete understanding of the metrics collected, analyzed, and reported in the environment. All aspects of these metrics have been clearly defined, agreed to, and documented in this one common repository. When someone has a question about a metric, we don't have to search through scattered files or sift through 10 different interpretations from 10 different people. We consult the single repository of documented fact.
One way of storing this catalog could be indicating that each metric is a configuration item (CI) stored in your configuration management database (CMDB), subject to your organization's change control practices. This ensures that any change to a metric is planned, discussed, tested, agreed to, and documented. Appropriate stakeholders and audiences are consulted when any metric is enacted, changed, or discontinued.
Inform Decision Making with Metrics
As practitioners, we must ensure that the metrics we are reporting provide value to our audiences – to inform their decisions about our services at operational, tactical, and strategic levels. As the organization matures and changes over time, vision and goals shift periodically. Your metrics and KPIs reported should be adjusted to align with the revised vision and goals.
Edward Gray is currently a systems integration and support specialist at the University of Mary Washington. He has served in IT at UMW for more than 16 years. He has a MS in Management Information Systems and holds a number of certifications, including CompTIA, Microsoft, ITIL, and HDI. He is a member of several professional organizations, including HDI and itSMF. He is the current manager of the itSMF USA Higher Education Community of Interest. More detailed information is available on his website.