Date Published April 27, 2017 - Last Updated December 6, 2017
If you are investing time in reading this article, you have most likely implemented a Knowledge-Centered Support (KCS) initiative and are seeing the benefits within your organization. You can also likely identify opportunities for improvement and areas in need of growth and further alignment. Maybe you are wondering how to measure those opportunities and coach the users of KCS to add additional value. Maybe you want to understand your support staff on a deeper level, comparing their participation to peers and against the team average. With those questions in mind, I’d like to tell you a story about our KCS journey here at Ticketmaster.
Our KCS launch went well, and we started to see results. But once we were into the third phase of the rollout, experiencing the benefits of higher client satisfaction and employee engagement, we noticed some anomalies in our results. Seasoned team members showed lower participation in some areas compared to new team members, and vice versa. This made us wonder how to measure KCS participation on an individual level.
Do you wonder how to measure KCS participation on an individual level?

As an example, we had some agents with high link rates but not creating articles of quality. We also had newer team members who were creating great articles and linking a lot, but not flagging any articles for updates. Individuals were succeeding in some areas and not others, and we could not make sense of the data. What were their struggles? Did they need targeted coaching? We had no answers for these and other important questions.
You have probably heard the adage, “What gets measured, gets done.” We decided to apply this philosophy to KCS at an individual level by combining specific KPIs into a centralized scoring system. The scores are then used by KCS coaches, Knowledge Domain Experts (KDEs), or supervisors to help encourage an individual’s growth within a specific area of KCS. We were able to create a formula that, like the articles, captured the data we needed in an easy to navigate solution. This formula generates a Use it, Flag it, Fix it, Add it (UFFA) score. I will walk you through how to use the formula to create a balanced scorecard that highlights all areas of KCS involvement.
See Chris present KCS: Driving Adoption Through an UFFA Balanced Scorecard at the HDI 2017 Conference & Expo.
Individual participation is measured within the UFFA model in six key areas: Articles created, the AQI score received, Articles Flagged or Modified, Articles Linked, and Cases Closed. For KCS, one of the main goals that drives the process is the link percentage. But what are the other goals and how can broader participation be tracked? By using this formula, an individual participation rate can be compared to those of the same ranking and the entire team. Results can be compiled in quarterly reporting and compared to annual goals.
Step 1: Report Metrics
The first step involves pulling report metrics on the following values and variables within KCS:
- Articles Created by author
- Articles Flagged by team member
- Articles Modified by team member
- Articles Linked to cases by closing team member
- Total cases closed by team member
-
Article Quality Index (AQI) score by author
If you have been using KCS for some time, these metrics are the backbone of your self-service support model. At a team level, you are trying to determine all the key aspects of KCS that need involvement and which KCS roles are fully participating in keeping the database evergreen. Keep in mind when pulling data that the total number of cases closed plays into an individual linking percentage and shows how many cases have solutions that exist within the database.
Step 2: Identify Roles
List out each role determined for your team. There can be as many roles as needed, depending on your support needs. It is suggested that the roles within your team are broken out by expectations and KCS licensed roles so that individuals can focus in specific areas.
For example, the expectation of someone new to your team versus someone who has been on your team for a decade is very different. These differences are accounted for within the UFFA scoring model. It allows for a KCS 3 to be compared to another KCS 3, not a KCS 1, and that average compared to the team as a whole.
To help with role definition, ask yourself these questions: How would you break out your team into groups with the purpose of emphasizing different aspects of their KCS participation? Are they working with legacy products or new releases with more information to dispense? Their organizational role and their KCS role can be combined for a matrix of possible outcomes. Here is an example of potential roles.:
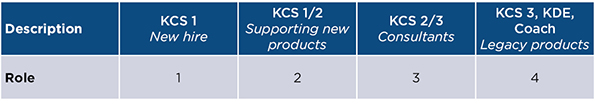
The staff within each role can also be compared to understand how best to delegate tasks based on workload.
Step 3: Define Expectations
The expectations associated with each role can be combined for a total score based on responsibilities within the team. A KCS 3 who also coaches and takes Tier 3 support issues does not have the same workload as a new team member who is learning how to handle their first call. UFFA reporting allows for these differences to be accounted for by assigning percentages to each of the metrics within each of the roles. Here is an example:
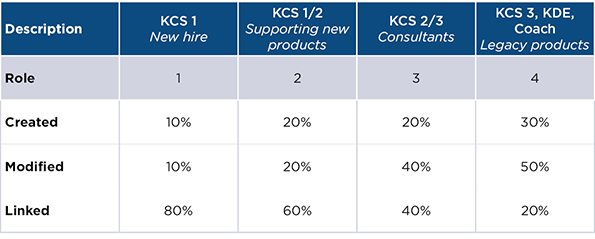
The building block of KCS is linking, which ends up being the main focus of a new employee because they are working known issues. As that employee matures, they begin focusing on the creation of higher value articles associated with unknown issues while also supporting the health of the knowledge base. That progression can now be tracked and a higher participation percentage can be added to their UFFA score metrics expectation if their focus needs to be shifted to an area with less engagement.
Step 4: Use the Formulas
The following formulas combine the above-referenced data points into an easy to reference UFFA score. You can download an Excel template that has each of these formulas listed within it. Below is an explanation of each formula:
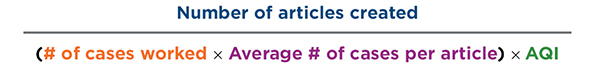
Formula A: Creation – Articles created and cases worked
Example:
Team totals - 191 articles created, 17,500 cases closed = .011 articles per case worked overall. The team average is 1 article for every 92 cases. The average number of cases per article is a team average.
Agent, Hack Wilson creates 20 articles, works 1800 cases and averages a 96% AQI.
His ratio is 1 article for every 90 cases. Mr. Wilson is basically right on pace with the team average.
The formula for the creation metric becomes:
20/(1800*.011)*.96 = 97%
A perfect AQI score would bring this overall creation score up to 100%. The UFFA score and reporting metrics put everyone on the same playing field, allowing the team average to determine individual goals.
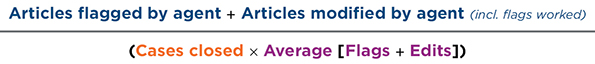
Formula B: Modify/Flagging – Metric depends on the specialist KCS role
KCS 1 – use this formula for individuals at KCS level 1

Example:
Elaine (KCS 1) flagged 20 articles and closed 1500 cases. The team average is 1 flag per 73.3 cases (1/73 = .013643)
The formula for the flagging metric becomes:
20/(1500*.013643) = 98%
KCS 2/3, KDE, Coach - use this formula for individuals beyond KCS level 1 – same formula, including edits by validation or working flags.
Example:
Cosmo (KCS 3) flagged 3, modified 3, and closed 1800 cases. The team average is 1 flag/edit per 25 cases (1/25 = .04)
The formula for the modify/flagging metric becomes:
6/(1800*.04) = 8%
Formula C: Linking – This is based off team linking goal
In this example, we are using a team linking goal of 70%, so linking 70 out of 100 cases will result in 100%. As I mentioned at the start, this is the most important metric, so be realistic but also push past the previous year’s total in order to raise engagement.

Example:
Rachel linked 1875 out of 2500 cases.
The formula for the Linking metric becomes:
1875/(2500*.70) = 107%
Since linking is the most important metric to track, it is the first metric on which to focus. Successful participation in the entire UFFA process is shown by the linking percentage. Everyone within the organization has the opportunity to link an existing article to a closed case and, depending on your rollout, most users can also create an article when there is no documented solution.
Step 5: Determine the UFFA Score
The final step is to combine this data into the UFFA score. After each metric has been gathered for each individual, they can be associated with the percentages defined and add up to a participation score.
Start with the creation formula total (Step 4, Formula A)
Multiply that total by the weight associated with the defined role (Step 3)
Do the same for the two remaining scores (Modify/Flag, Linking – Step 4, Formula B and C) and the weights associated with their roles.
Here is an example:
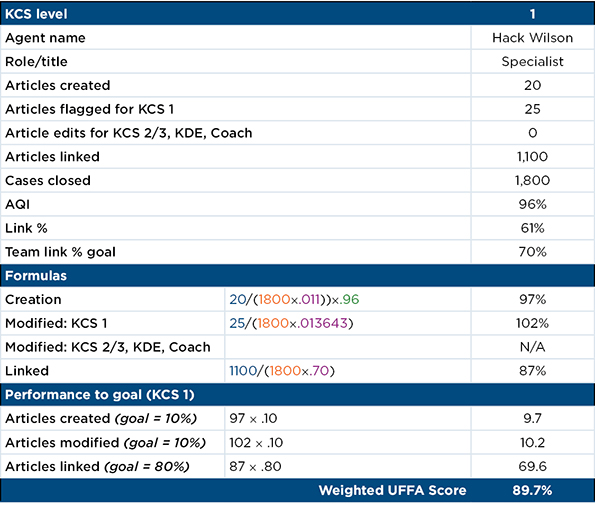
As you can see, for support agent Wilson, we took the creation score of 97%, then multiplied it by 10%, Then we took that score and added the modify score of 102% multiplied by 10%. This team member is weighted heavily in the area of linking, so their lower link score (61% versus 70%) shows in their overall score.
The UFFA score for this individual came to 89.7%. A great rule of thumb is to consider 100% score as right on the mark with the rest of the team. Straying too far in either direction means either a lack of participation or the employee is being over utilized and prone to burnout.
Remember, the main goal of this report is to analyze the data at an individual level and coach for the specific areas in need of improvement. In the above example, Hack is doing a good job creating articles and flagging them for updates, but is not linking many of his cases to articles used. Since he is new to the company and a KCS level 1, linking is his primary focus. With these metrics, his participation can be understood and coaching can be targeted and more of an emphasis can be weighted toward linking.
The UFFA score totals displayed below show each specialist broken out by metric and KCS role.
Here is an example of what the final data might look like before combining them for an UFFA score:
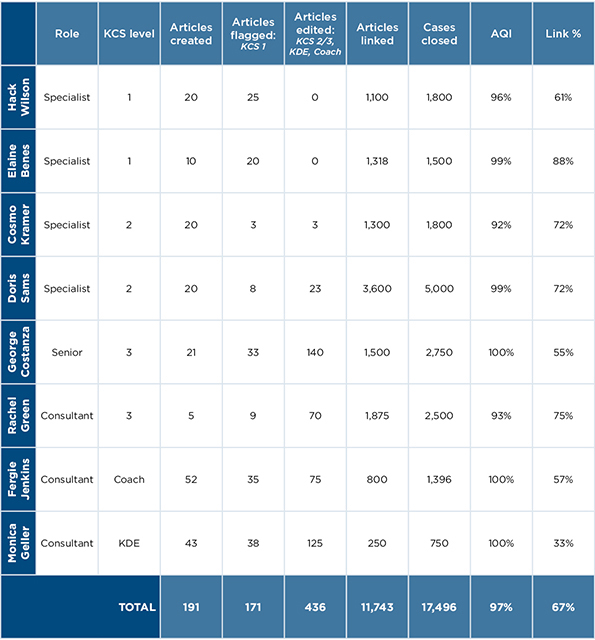
It is important to note that this formula is not usually shared with the support staff. Most agents are aware of their own participation, or lack thereof, and these results are not a surprise. This report simply highlights the areas in need of improvement and gives management the opportunity for targeted coaching.
As an organization, we know the KCS program is successful because our client survey scores for knowledge have increased dramatically over the course of our rollout. Before we launched the KCS initiative, knowledge was always ranked last behind speed of service and professionalism. Once we shifted our support model implementing KCS, those scores shot through the roof!
We aren’t technically any smarter overall, but following the KCS methodology helped us offer what we did know to our clients in a way that exceeded our expectations. With the UFFA balanced scorecard, results can be quantified to help the management staff identify areas for improvement and focus our resources on those areas. Together, we have the answers we need for success!
One of the founding members of the Ticketmaster Product Support Help Desk, Chris Kloepping started out on the phones taking calls and quickly moved into managerial roles. Today, his team of 37 supports all Ticketmaster proprietary software and hardware for both internal and external clients throughout North America. He had the privilege to provide tech support at both the Athens and London Olympics.