Date Published February 14, 2018 - Last Updated December 13, 2018
Each month, I highlight one Key Performance Indicator (KPI) for service and support. I define the KPI, provide recent benchmarking data for the metric, and discuss key correlations and cause-and-effect relationships for the metric. The purpose of the column is to familiarize you with the KPIs that really matter to your organization and to provide you with actionable insight on how to leverage these KPIs to improve your performance! This month, I focus on percent resolved level 1 capable.
Jeff taught the Succeeding with Metrics pre-conference class at HDI 2018.
Learn more!
Percent resolved level 1 capable is a desktop support metric. It measures the percentage of tickets resolved by desktop support that could have been resolved by the level 1 service desk. This happens when the service desk dispatches or escalates a ticket to desktop support that could have been resolved by the service desk or when a user bypasses the service desk altogether and goes directly to desktop support for a resolution to their incident. Although the metric is tracked at desktop support, it has strong implications for both desktop support and the service desk.
Let’s say, for example, that a desktop support group handles an average of 1,000 tickets per month. Let’s further assume that 200 of these tickets could have been resolved by the service desk. The value for percent resolved level 1 capable would be 20% (200 tickets resolvable at level 1 ÷ 1,000 tickets resolved by desktop support).
Ideally, this metric should be as low as possible because it costs much more to resolve a ticket at the site of a user (desktop support) than it costs to resolve a ticket remotely by the level 1 service desk. Indeed, “Get it done at level 1!” has become a common rallying cry for many support organizations who recognize that one way to minimize support costs is to resolve as many tickets as possible at the service desk!
Get it done at level 1! has become a common rallying cry for many support organizations.

Percent resolved level 1 capable is typically tracked when a desktop support technician closes out a ticket. If the judgment of the technician is that the ticket could have been resolved by the service desk, they will check a box on the ticket indicating that the ticket was resolvable at Level 1. This method requires periodic audits to ensure that desktop support technicians are accurately reporting tickets that could have been resolved by the service desk. An audit can be performed by reviewing a representative sampling of tickets each month to determine if the tickets designated resolvable at level 1 could, in fact, have been resolved by the service desk. Likewise, tickets not designated as resolvable at level 1 are sampled to determine if tickets are routinely being missed that should have been designated as resolvable at level 1.
Why It’s Important
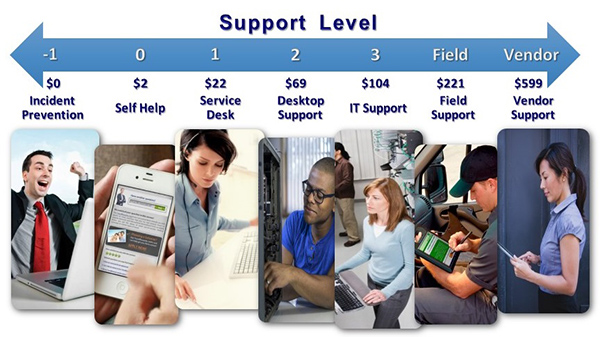
Total Cost of Ownership (TCO) for end user support includes the cost of support from all sources, including the service desk, desktop support, other groups or individuals in IT, and vendors. It is a well-established fact that the cost of resolving a ticket at level 1 is lower than the cost of resolving a ticket at desktop support. The figure below shows the average cost per ticket for resolution at various support levels in an organization. These figures represent fully loaded costs, including all personnel salaries and benefits, desktop technology and software licensing fees, telecom, facilities, travel, training, and office supplies. Furthermore, these costs are additive; if a user first contacts the service desk, and the service desk in turn opens a ticket and dispatches it to desktop support, the total cost of resolution is $22 for the service desk plus an additional $69 for desktop support, for a total of $91. The clear message here is that getting it done at level 1 is not just a catchy phrase; it can significantly reduce your support costs!
Minimizing Defects
Every ticket resolved at desktop support that could have been resolved by the level 1 service desk represents a defect in the support organization. You can estimate the cost of these defects by multiplying the number of defective tickets by the cost of resolution at desktop support. Continuing with our example from above with 200 tickets that could have been resolved at level 1, and multiplying that by the $69 per desktop support ticket from the figure, we get an estimated defect cost of $13,800 per month. The cost of these escalation defects can really add up! So how do we minimize them?
Here are four suggestions for minimizing the percent resolved level 1 capable:
- Begin tracking the metric at desktop support. You cannot control, let alone reduce the number of ticket defects until you begin tracking percent resolved level 1 capable.
- Conduct root cause analysis on the tickets that are being escalated to desktop support that should have been resolved by the service desk. Are there common themes? Are they coming disproportionately from one or more agents? How many are the result of customers bypassing the service desk and going directly to desktop support with their support requests?
- Provide targeted training at level 1 to increase awareness of the importance of this metric and to reduce the number of tickets dispatched to desktop support and other IT groups that should be resolved by the service desk.
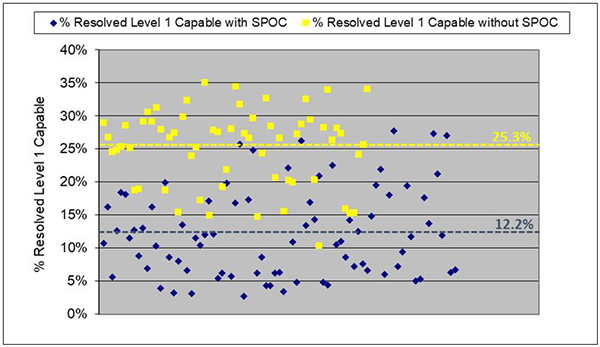
- Insist upon a strict Single Point of Contact (SPOC) support model, whereby all customer incidents and service requests go through the service desk. This will prevent “drive-bys,” which happen when desktop support technicians get pulled into an on-the-spot support request without a ticket first being logged and dispatched by the service desk. The figure below shows that support organizations following a strict SPOC model average 12.2% for percent resolved level 1 capable, while those that do not follow a strict SPOC model are more than double that, at 25.3%.
Benchmark Data for Percent Resolved Level 1 Capable
MetricNet’s benchmarking database shows that percent resolved level 1 capable ranges from a low of 2.7% to a high of 35.1%, with an average value of 17.8%. That is, 17.8% of all tickets closed by desktop support could have and should have been resolved by the service desk. This is a surprisingly large number and indicates that most support organizations have ample opportunity to reduce their support costs by managing this metric more aggressively. To perform in the top quartile for this metric, your percent resolved level 1 capable should be less than 10.4%.
Please join us for next month’s Metric of the Month: Tickets per User per Month, a workload metric that impacts staffing decisions and provides insight into the complexity of the customer environment.
Jeff Rumburg is the winner of the 2014 Ron Muns Lifetime Achievement Award, and was named to HDI’s Top 25 Thought Leaders list for 2016. As co-founder and CEO of MetricNet, Jeff has been retained as an IT service and support expert by some of the world’s largest corporations, including American Express, Hewlett Packard, Coca-Cola, and Sony. He was formerly CEO of the Verity Group and Vice President of Gartner. Jeff received his MBA from Harvard University and his MS in Operations Research from Stanford University. Contact Jeff at
[email protected]
. Follow MetricNet on Twitter @MetricNet.