Date Published November 16, 2017 - Last Updated December 6, 2017
Each month, I highlight one Key Performance Indicator (KPI) for service and support. I define the KPI, provide recent benchmarking data for the metric, and discuss key correlations and cause-and-effect relationships for the metric. The purpose of the column is to familiarize you with the KPIs that really matter to your organization and to provide you with actionable insight on how to leverage these KPIs to improve your performance! This month, I look at first level resolution rate.
First level resolution (FLR) is a measure of a service desk’s ability to resolve tickets at Level 1, without having to escalate the ticket to Level 2 (Desktop Support), Level 3 (internal IT professionals in applications, networking, the data center, or elsewhere), field support, or vendor support. FLR is not to be confused with its close cousin, first contact resolution. Let me provide an example to illustrate the difference.
Take the situation where a Level 1 agent accepts a call, logs a ticket, but fails to provide a solution to the caller on the initial contact. But rather than escalate the ticket, the Level 1 agent researches the user’s issue, identifies an appropriate solution, calls the user back, delivers the solution, and closes out the ticket. Although the ticket was not resolved on first contact, it was resolved at Level 1.
Now let’s take the situation where the Level 1 agent accepts a call, logs a ticket, and warm transfers the caller to a Level 3 IT professional who works in the NOC. The Level 3 professional takes over the call and provides a solution for the ticket before the user hangs up. This ticket was resolved on first contact, but was not resolved at first level.
It is also helpful to note that first contact resolution is a quality metric that strongly impacts customer satisfaction, while first level resolution is a cost metric that strongly influences total cost of ownership for end-user support.
Net vs. Gross FLR
To have a meaningful discussion of FLR, we must make a further distinction between gross FLR, and Net FLR. Gross FLR is the ratio of All Tickets Resolved at Level 1, to all Tickets Logged at Level 1. Net FLR, by contrast, is the ratio of all tickets resolved at Level 1 to all tickets that can potentially be resolved at Level 1. Gross FLR is self-explanatory. It is a simple ratio that is very intuitive to most people. However, to fully appreciate Net FLR, it is necessary to define a “carve-out”: A carve-out is a ticket type that for one reason or another cannot be resolved at Level 1. A carve-out can be the result of a physical limitation (it is physically impossible to replace a hardware component remotely, at Level 1, for example), or it might be the result of policy or security restrictions placed on Level 1 support, such as when Level 1 is not granted access rights to certain systems. The denominator of the Net FLR ratio is equal to the number of tickets logged at Level 1, minus the number of ticket carve-outs.
Net FLR is by far the more important of the two metrics, for it measures the true effectiveness of the Level 1 service desk to resolve tickets within their purview of defined responsibility.
First Level Resolution and TCO
Figure 1 below illustrates the cost per ticket for resolution at different support levels. This data represents North American averages and is a fully loaded cost, including agent salaries and benefits, salaries and benefits for indirect personnel (e.g., trainers and workforce schedulers), facilities expense (rent, lease, or depreciation for the occupied facilities), insurance, telecom, desktop technology (licensing fees, desktop/laptop computers, etc.), travel, training, and office supplies. Clearly, as a ticket is escalated, and resolution moves further away from the Level 1 service desk, the cost of resolution increases. Furthermore, these costs are cumulative. If a ticket is logged at Level 1 and then escalated to Level 2 (Desktop Support) for resolution, the average cost of resolution is not just $69, but $69 plus $22, for a total of $91.
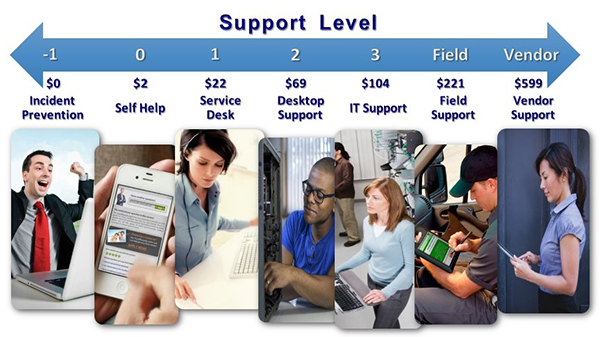
The cost of resolution increases at each successive level for a variety of reasons, including longer handle times and higher salaries at support levels above the service desk. So, for example, a ticket that might be resolved in 10 minutes at Level 1, could take 30 minutes or more to resolve at Level 2 because it requires a visit to the site of the user. The same ticket, when resolved at Level 3, involves personnel that are more highly paid than Level 1 agents, and who are (frankly) slower to resolve tickets because they are not full-time support professionals. The clear implication is that any ticket that can be resolved at Level 1 should be resolved at Level 1 and that maximizing FLR is the equivalent of minimizing TCO!
Any ticket that can be resolved at Level 1 should be resolved at Level 1.

Key Drivers of First Level Resolution
FLR is a function of many factors, including ticket complexity and agent experience. The primary levers for driving FLR higher are training and technology. It can be shown that better trained, more experienced Level 1 agents produce higher first level resolution rates. And two technologies in particular can improve first level resolution.
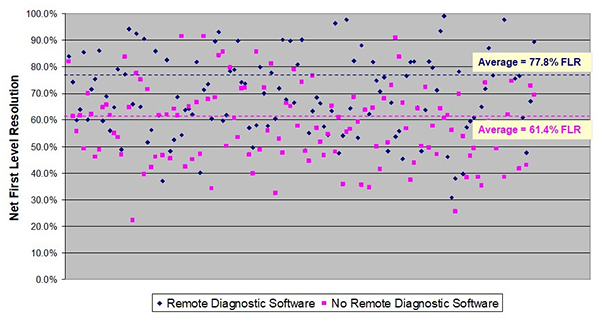
First are remote control tools that enable Level 1 agents to proxy into a user’s device for troubleshooting. The figure below shows the difference in FLR between service desks that use a remote control tool and those that do not. The average FLR for those with a remote control tool is 77.8%, while the average FLR for those without this technology is just 61.4%. These tools are relatively easy to cost justify for this reason alone!
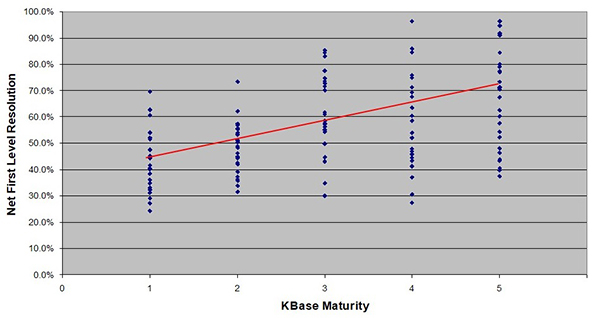
Knowledge tools have a similar effect on FLR. The figure below shows that as Knowledge-Centered Services (KCS) matures in an organization, FLR increases.
Benchmarking Ranges for First Level Resolution Rate
The global averages and ranges for FLR in 2017 are shown below.
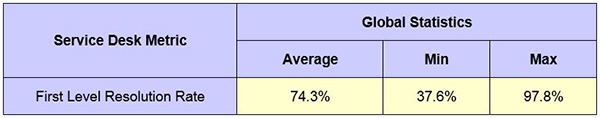
The range on this metric (min to max) is quite large. The reasons for this were outlined above and include the complexity of tickets handled, user training and experience, and the adoption of technologies such as KCS and remote control.
Please join me for next month’s Metric of the Month: The Service Desk Balanced Scorecard, an aggregate metric that provides a single measure of overall service desk performance and enables us to trend our performance over time!
Jeff Rumburg is the winner of the 2014 Ron Muns Lifetime Achievement Award, and was named to HDI’s Top 25 Thought Leaders list for 2016. As co-founder and CEO of MetricNet, Jeff has been retained as an IT service and support expert by some of the world’s largest corporations, including American Express, Hewlett Packard, Coca-Cola, and Sony. He was formerly CEO of the Verity Group and Vice President of Gartner. Jeff received his MBA from Harvard University and his MS in Operations Research from Stanford University. Contact Jeff at
[email protected]
. Follow MetricNet on Twitter @MetricNet.