by Randy Steinberg
Date Published June 25, 2025 - Last Updated June 25, 2025

Unplanned IT outages can disrupt business operations, lead to lost revenue and damage company reputation. The Service Desk can take proactive action to coordinate and lead efforts across the different IT support and technical organizations to make a real difference that lowers the frequency of incidents, increases customer satisfaction and reduces unplanned IT costs and labor.

Here are 6 techniques that can be used to get to their root causes and take action now. The Service Desk can act as a coordinator/leader for using these techniques to get results and improve service.

Technique: The 5 Whys

Best Use:

  • Uncertain whether a presented solution is truly the solution.
  • Uncertain where to start when trying to find a solution.
  • Changing the mindset of support staff to focus on causes versus symptoms.

How It Works:

  1. Describe what took place.
  2. Ask “Why?”
  3. Listen to answer given.
  4. Ask “Why?” again.

Repeat steps 2-4 until root cause is identified.

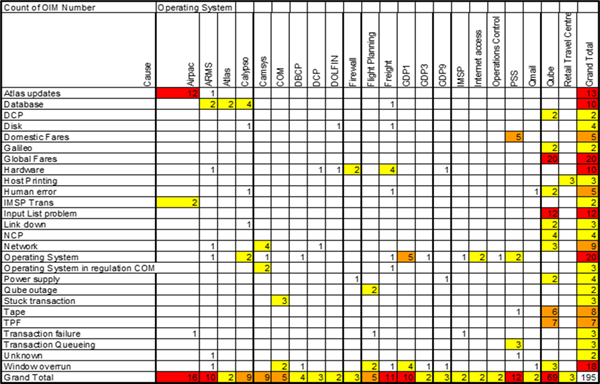
Technique: Trend Analysis

Best Use:

  • Identifying underlying problems which if removed, will reduce the number of incidents in the IT infrastructure.
  • Prioritizing problem-solving efforts.

How It Works:

  1. Assign categories to problems.
  2. List problems by category.
  3. Identify volume of incident occurrences for each problem.
  4. Identify those problems with highest frequency.
  5. Address problems associated with most incidents.

a screenshot of a trend analysis

Technique: Solution Brainstorming

Best Use:

  • Major and complex issues that cross multiple technology domains.
  • Uncertainty over which issues should be addressed first.
  • Intermittent problems that appear to come and go and can’t be recreated or repeated in a test environment.
  • Uncertainty over where to start for problems that appear to have multiple causes.
  • Struggling to identify the exact point of failure for a problem.
  • Uncertain where to start when trying to find root cause.

How It Works:

  1. Assemble the experts.
  2. Each write down possible root causes – 1 per card.
  3. Leader mounts cards one by one on board in roundtable fashion.
  4. Each card is discussed as it is mounted.
  5. Related cards are grouped.
  6. Each expert is assigned one or more cards and must prove whether the item on the card is truly a root cause.

Technique: Pain Value Analysis

Best Use:

  • Uncertainty over which problems should be addressed first.
  • Identifying those problems that impact the business the most.

How It Works:

  1. Develop a list of problems.
  2. For each problem:
    1. Identify number of people affected
    2. Identify duration of downtime
    3. Estimate business costs from downtime (unplanned labor, lost sales, fines, penalties, etc.)
  3. Weigh each problem by above factors.
  4. Sort the list to identify the top problems to focus on first.

a pain value analysis chart

Technique: Fault Isolation

Best Use:

  • Eliminating “noise” when working problems to root cause.
  • Uncertain where to start when trying to find root cause.
  • Struggling to identify the exact point of failure for a problem.
  • Using support staff time efficiently to get to root cause.

How It Works:

  1. Identify all Configuration Items (CIs) involved in the transaction or event at fault.
  2. Identify the chain or path of the CIs .
  3. Re-execute transactions or event in stepwise fashion:
    1. Move to the first CI – did it work correctly?
    2. Go to the next CI – did it work correctly?
    3. Repeat steps a & b until fault is found
  4. If fault cannot be re-created:
    1. Check health state of all CIs for transaction or event.
    2. For each CI found at fault trace the chain in reverse.

Technique: Pareto Analysis

Best Use:

  • Uncertainty over where to start for problems that appear to have multiple causes.
  • Uncertain where to start when trying to find root cause.
  • Separating the most important potential causes of failures from more trivial issues.

How It Works:

  1. Form a table listing the causes and their frequency as a percentage.
  2. Arrange the rows in the decreasing order of importance of the causes, i.e. the most important cause first.
  3. Add a cumulative percentage column to the table.
  4. Select the top causes for the problem.

an image of a pareto chart outlining problems and causes

Use these as part of a Continual Service Improvement program. Try some of these in your organization and see what a difference it can make.

Tag(s): supportworld

Related:

More from Randy Steinberg

    No articles were found.